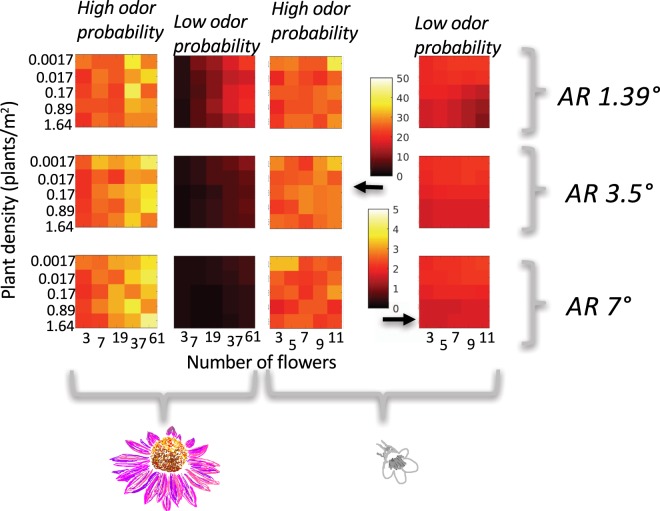
Figure 6.
Heat maps indicating average distance at which a resolvable sensory signal was encountered in successful model runs. These likelihoods were calculated for: 1. multiple plant sizes, indicated by a variable number of flowers on the x axes; 2. multiple plant densities, indicated on the y axes; 3. two different plant species, Echinacea (two left columns) and Penstemon (two right columns); 4. two different odor probabilities (labelled by column); and 5. three different visual acuities, labelled with their angular resolution on the right hand side of the figure.

