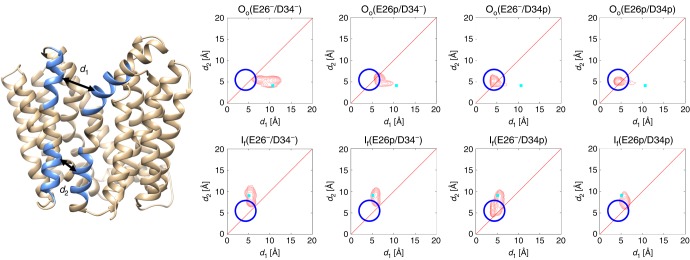
Fig. 5.
Conformational distributions of MdfA obtained following MD simulations. Starting from each initial conformation (Oo vs. If) and Glu26/Asp34 protonation state, the conformational distributions of the MD simulations were calculated as a function of d1 and d2 (d1: minimum distance between Cα atoms of residues 156–165 (TM5) and those of residues 253–262 (TM8); d2: minimum distance between Cα atoms of residues 139–148 (TM5) and those of residues 270–279 (TM8)). Cyan squares indicate the corresponding distances in the initial conformations (Oo: this study; If PDB 4ZOW), and the blue circles indicate the position of the peak in the plot for Oo(E26−/D34p)

