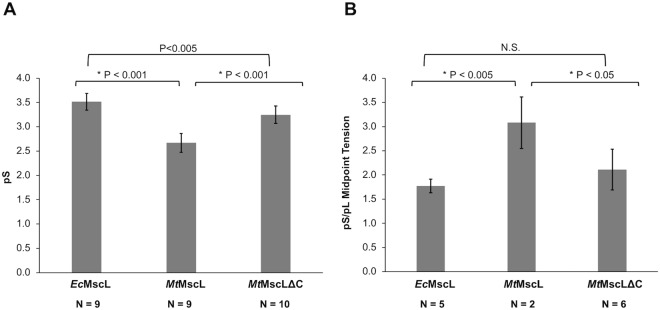
Figure 5.
Unitary conductance and MscL/MscS midpoint ratios. (A) Average unitary conductance from the indicated number of patches from BL21 DE3 ΔmscL cells expressing EcMscL WT, MtMscL WT, or MtMscLΔC. Membrane potential was clamped at −20 mV. (B) MscL/MscS midpoint ratios for EcMscL, MtMscL WT, and MtMscLΔC from the indicated number of patches derived from BL21 DE3 ΔmscL cells. Significant differences between pairs, based on Student’s t-test are reported above the charts.

