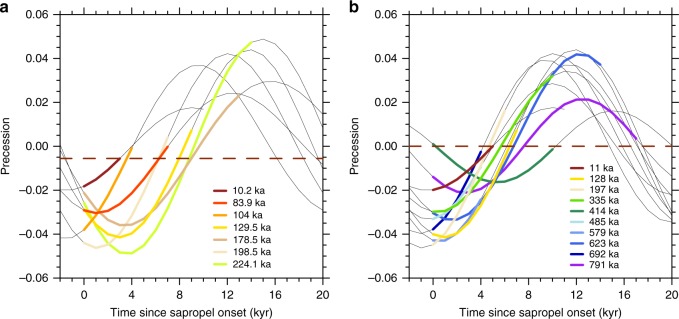
Fig. 3.
The relationship between sapropel formation and orbital precession using two sapropel chronologies. Precessional curves associated with sapropel formation are aligned to the start of each occurrence according to the respective chronology. The coloured segments of these curves indicate the actual duration of the sapropel. The red horizontal line indicates the precession at the termination of the most recent sapropel. a A speleothem-tuned chronology24 provides well-constrained estimates of the onset and termination of sapropels over the past 250,000 years. b The past ten interglacial sapropels seen in a Mediterranean Sea level record25

