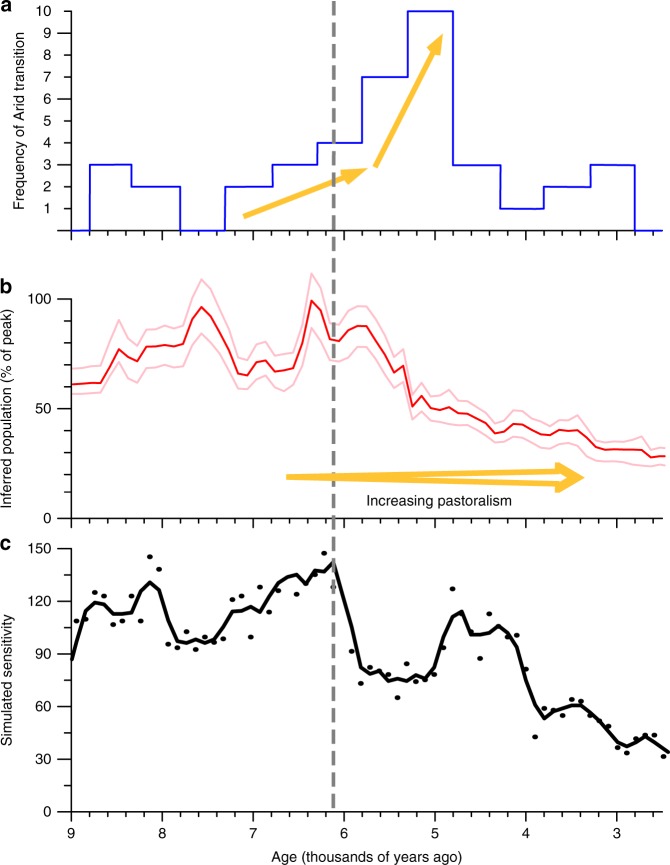
Fig. 5.
Potential interaction between humans and the ecosystem during the end of the African humid period. a Histogram of the number of climate proxies (Fig. 1a) indicating an end of the African Humid Period within a 500 year window3. b The population inferred summed probability distribution22 over the whole of northern Africa region along with its 5–95% confidence level. c The simulated sensitivity of northern Africa diagnosed from the model. Black dots show the number of not-implausible model settings with a threshold time, t∗, in each century (see Methods for details); the black line is a 3 point running average. The gray line vertical indicates the time of the maximum simulated sensitivity

