Fig. 1.
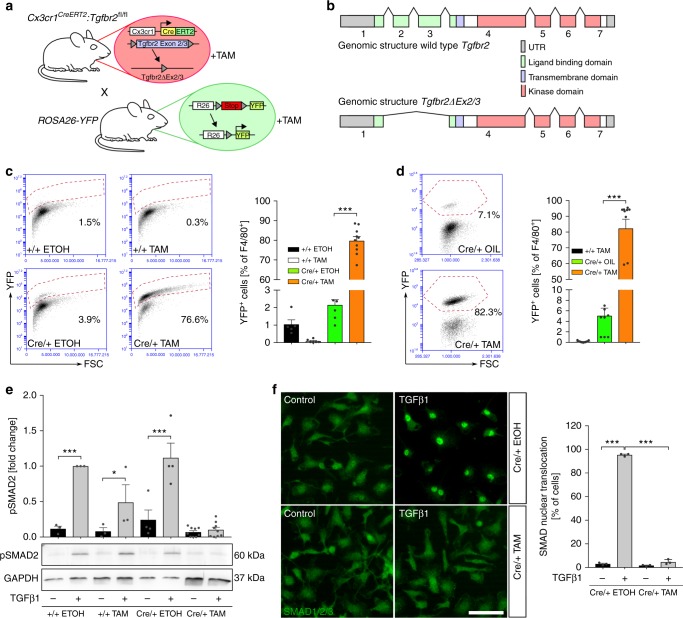
Successful microglia-specific knockout of Tgfbr2 in vitro and in vivo. a Scheme illustrating breeding strategy to obtain Cx3cr1CreERT2:R26-yfp,Tgfbr2fl/fl mice for TAM-induced deletion of Tgfbr2 Exons 2/3 and induction of YFP reporter gene expression. b Genomic structure of wild-type and mutant Tgfbr2 after TAM-induced recombination. c Flow cytometric analysis of microglia 3 days after TAM-induced recombination in vitro for expression of YFP. Data are presented as mean ± SEM (+/+ EtOH n = 5, +/+ TAM n = 6, Cre/+ EtOH n = 7, Cre/+TAM n = 10). P values derived from one-way ANOVA are ***p < 0.001. d Flow cytometric analysis of YFP reporter gene expression 4 weeks after recombination in vivo. Data are given as means ± SEM (+/+ TAM n = 12, Cre/+ OIL n = 8, Cre/+ TAM n = 10). P values derived from one-way ANOVA are ***p < 0.001. e Primary microglia from newborn Cx3cr1CreERT2:R26-yfp,Tgfbr2fl/fl were recombined in vitro. Control (+/+ EtOH, +/+ TAM, Cre/+ EtOH) and knockout (Cre/+ TAM) samples were treated with TGFβ1 (5 ng/ml) for 2 h. Quantification of SMAD2 phosphorylation (pSMAD2) after densitometric evaluation and GAPDH normalisation (+/+ EtOH n = 3, +/+ TAM n = 3, Cre/+ EtOH n = 4, Cre/+ TAM n = 9). Data are given as fold changes compared to +/+ EtOH-treated samples. P values derived from one-sample t tests are *p < 0.05 and ***p < 0.001. f Nuclear translocation of SMAD2 was determined in primary microglia after treatment with TGFβ1 (5 ng/μl) for 2 h. Scale bar represents 50 µm. Data are given as means ± SEM from three independent experiments. P values derived from one-way ANOVA are ***p < 0.001

