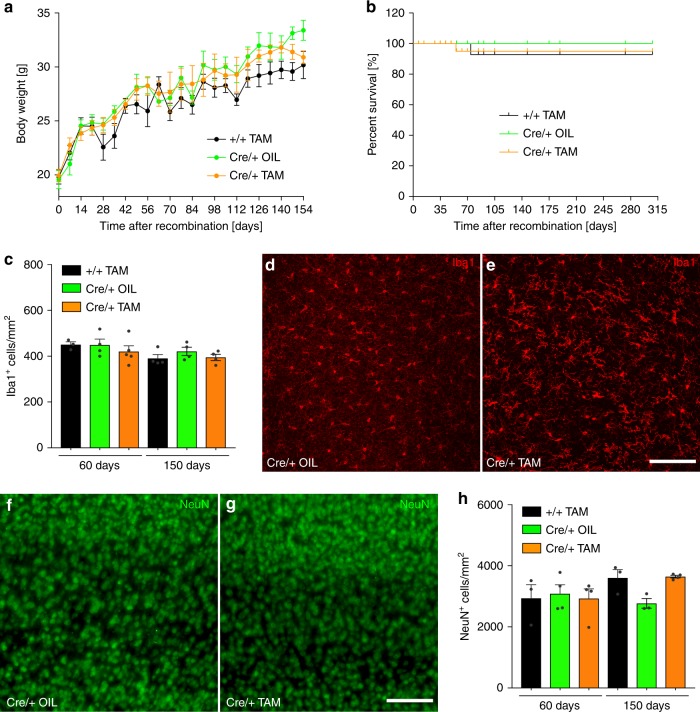
Fig. 2.
Normal mouse survival and no impairment of microglia maintenance after microglia-specific knockout of Tgfbr2. a Body weight increase after TAM-induced recombination at 6−8 weeks of age (timepoint 0). Weights were measured weekly in control (+/+ TAM, Cre/+ OIL) and knockout (Cre/+ TAM) animals. Data points indicate mean ± SEM (n = 3–18 mice). b Kaplan−Meier survival curves of control and knockout mice after TAM-induced recombination in vivo. c Microglia numbers given as Iba1+ cells/mm2 were obtained from three cortical fields per animal. Iba1+ microglia were analysed 60 days and 150 days after TAM-induced recombination. d Iba1 immunostainings from the cortices of control mice (Cre/+ OIL) and e knockout mice (Cre/+ TAM) after 60 days. Cortical neuron (NeuN+) distributions in f control mice and g knockout mice 60 days after TAM-induced recombination. Scale bars represent 100 µm. h Quantification of cortical neuron numbers in control (+/+ TAM, Cre/+ OIL) and knockout (Cre/+ TAM) animals revealed no significant changes. Data are given as means ± SEM from at least three animals per genotype and timepoint

