Fig. 3.
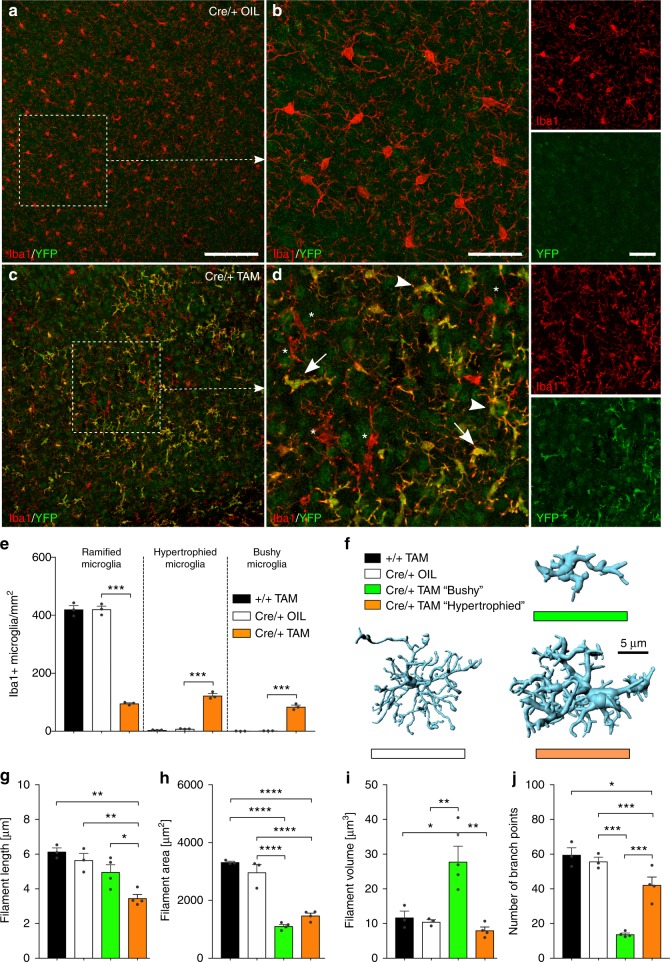
Distinct morphological changes of microglial in Cx3cr1CreERT2:R26-yfp,Tgfbr2fl/fl mice. Normal microglia distribution and ramification (a) as well as normal microglia morphology and no YFP+ cells in control mice 4 weeks after TAM injections (b). Distinct heterogenous distribution (c) and morphological changes of YFP+/Iba1+ microglia 4 weeks after TAM-induced deletion of Tgfbr2 (d). Based on their morphology, microglia in cre/+ TAM knockout mice were divided into “normally ramified”, “bushy”, and “hypertrophied”. White arrowheads mark hypertrophied microglia, white arrows mark bushy microglia, and white asterisks mark YFP-/Iba1+ nonrecombined microglia. Scale bars represent 100 µm (a, c) and 25 µm (b, d). e Prevalence of normally ramified, bushy, and hypertrophied microglia in different experimental groups. Data are given as means ± SEM from at least three animals per genotype 4 weeks after recombination. P values derived from one-way ANOVA are ***p < 0.001. f Imaris (Bitplane)-based three-dimensional reconstructions of representative Iba1+ microglia from Cx3cr1CreERT2:R26-yfp,Tgfbr2fl/fl mice. Imaris-based automated quantification of microglial filament length (g), filament area (h), filament volume (i), and numbers of branch points (j). Data are presented as means ± SEM of 20 cells in 3−4 animals per group. P values derived from one-way ANOVA are *p < 0.05, **p < 0.01, ***p < 0.001 and ****p < 0.0001

