Fig. 4.
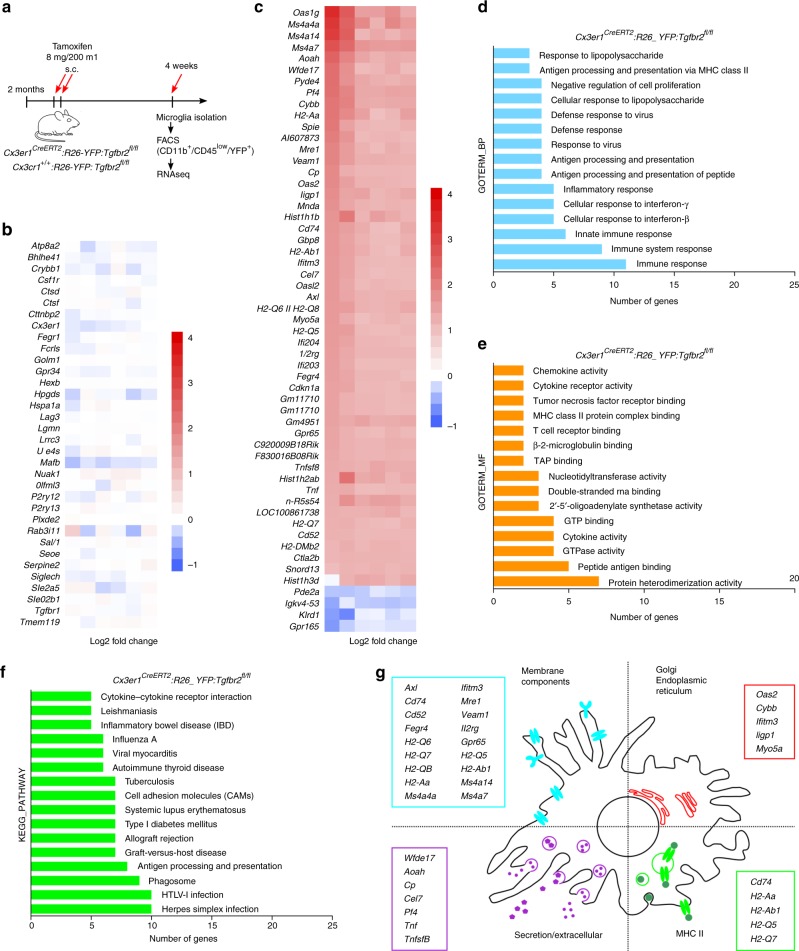
Gene expression pattern of Tgfbr2-deficient microglia indicates microglia activation and increased immune responses. a A timeline depicting TAM-treatment and microglia isolation/sorting for RNA isolation. b Heatmap analysis of RNAseq expression data of microglia isolated after TAM-induced recombination of Cx3cr1CreERT2:R26-yfp,Tgfbr2fl/fl mice (n = 6). TAM-induced Cx3cr1+/+:R26-yfp,Tgfbr2fl/fl mice (n = 6) were used as controls displaying no significant changes in expression of microglia-specific genes in Tgfbr2-deficient microglia. c Heatmap analysis of RNAseq expression data showing differentially expressed genes in Tgfbr2-deficient microglia. d GO term enrichment analysis of biological process (GOTERM_BP), e molecular function (GOTERM_MF) and f KEGG pathway enrichment analysis was performed using DAVID Bioinformatics Resources 6.8. g Scheme for microglia cellular compartment enrichment analysis is depicted with individually regulated compartment-associated genes

