Fig. 5.
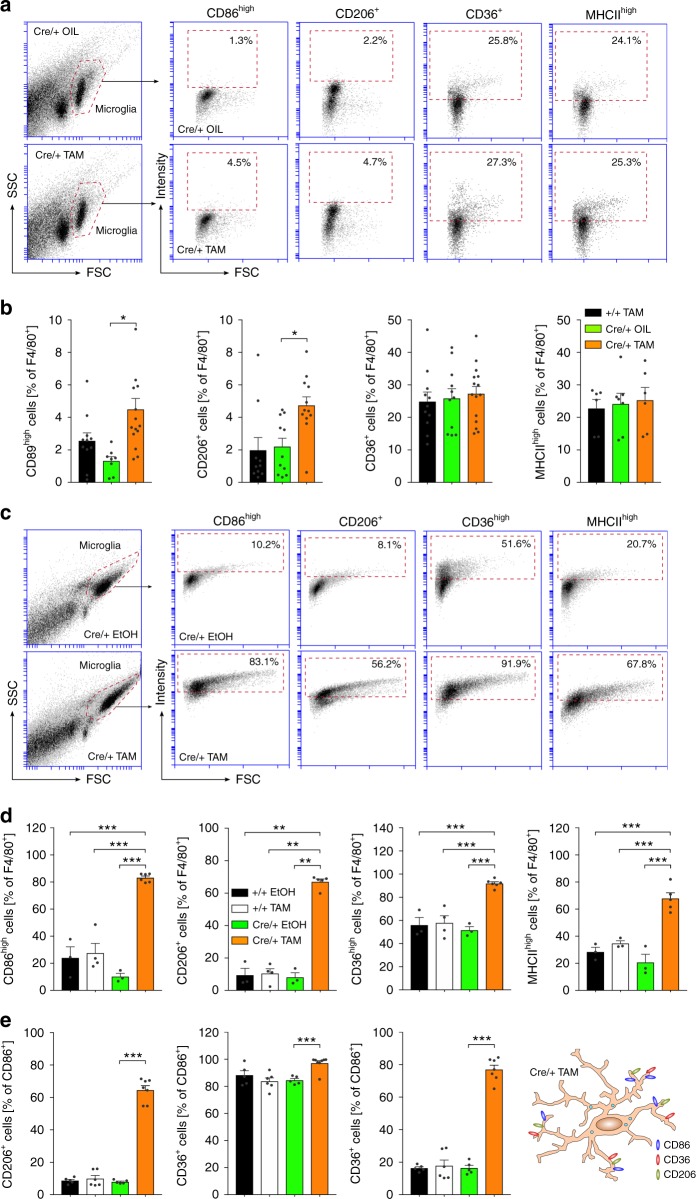
Analysis of microglial activation marker after TAM-induced deletion of Tgfbr2 in vivo and in vitro. a Flow cytometry analysis of microglia activation markers CD86, CD206, CD36, and MHCII after TAM-induced recombination in vivo. Representative flow cytometry graphs are shown for microglia from Cre/+ OIL control (top) and Cre/+ TAM knockout (bottom) Cx3cr1CreERT2:R26-yfp,Tgfbr2fl/fl mice. b Quantifications of CD86high, CD206+, CD36+ and MHCIIhigh microglia (F4/80+) are depicted. Data are presented as means ± SEM of at least six independent experiments. p values derived from one-way ANOVA are *p < 0.05. c Flow cytometry analysis of microglia activation markers CD86, CD206, CD36 and MHCII 5 days after TAM-induced recombination in vitro. Representative flow cytometry graphs are shown for Cx3cr1CreERT2:R26-yfp,Tgfbr2fl/fl microglia after treatment with EtOH (Cre/+ EtOH, top) and TAM (Cre/+ TAM, bottom). d Quantifications of CD86high, CD206+, CD36high and MHCIIhigh microglia (F4/80+) are presented. e Quantifications of CD86+/CD206+, CD86+/CD36+ and CD206+/CD36+ double-positive microglia demonstrating the presence of all markers on the majority of F4/80+ Tgfbr2-deficient microglia (Cre/+ TAM) in vitro. Data are presented as means ± SEM of at least 63 independent experiments. p values derived from one-way ANOVA are *p < 0.05, **p < 0.01 and ***p < 0.001

