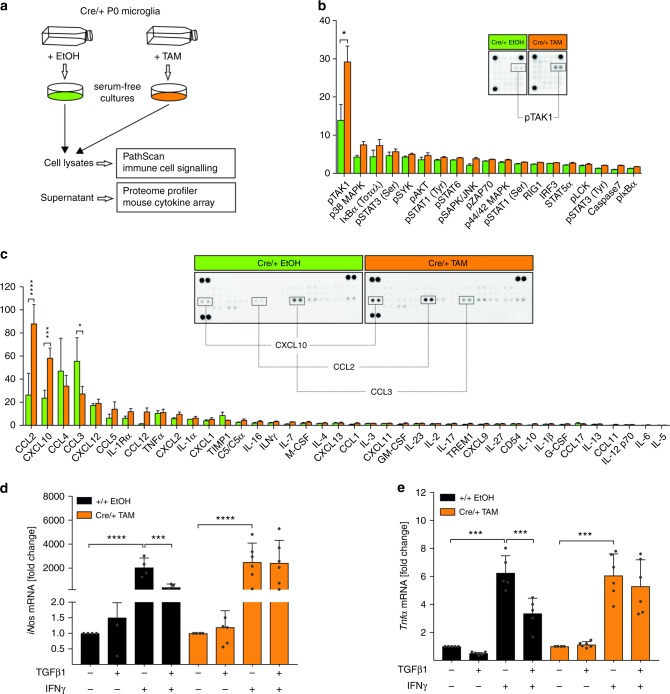
Fig. 6.
Microglial-specific knockout of Tgfbr2 leads to increased TAK1 phosphorylation and increased CXCL10 and CCL2 secretion. a Primary microglia from P0 Cx3cr1CreERT2:R26-yfp,Tgfbr2fl/fl mice were recombined in vitro and serum-free microglia shake-off cultures were prepared after 5 days. Microglia cell lysates were used for the detection of activated signalling proteins using the CST PathScan® Immune Cell Signaling Antibody Array Kit and supernatants of control (Cre/+ EtOH) and knockout (Cre/+ TAM) microglia were used for cytokine and chemokine detection using the Proteome Profiler Mouse Cytokine Array. b Densitometric spot analysis of array membranes revealed increased TAK1 phosphorylation in Cre/+ TAM microglia. Data are presented as means ± SEM from eight independent experiments. p values derived from one-sample t tests are *p < 0.05. c Quantification of cytokine secretion was performed by densitometric spot analysis of array membranes. Data are presented as means ± SEM from three individual experiments. p values derived from one-sample t tests are *p < 0.05, ***p < 0.001 and ****p < 0.0001. Primary microglia from Cx3cr1CreERT2:R26-yfp,Tgfbr2fl/fl mice were recombined in vitro, stimulated with TGFβ1 (5 ng/ml) for 2 h and subsequently with IFNγ (10 ng/ml) or TGFβ1 + IFNγ for 24 h. mRNA levels of iNos (d) and Tnfa (e) values from quantitative RT-PCR were normalised to Gapdh. Graphs display fold changes compared to unstimulated samples of +/+ EtOH control samples and cre/+ TAM knockout samples, respectively. Data are presented as means ± SEM (+/+ EtOH n = 4−5, Cre/+ TAM n = 5−6). p values derived from one-way ANOVA are ***p < 0.001 and ****p < 0.0001

