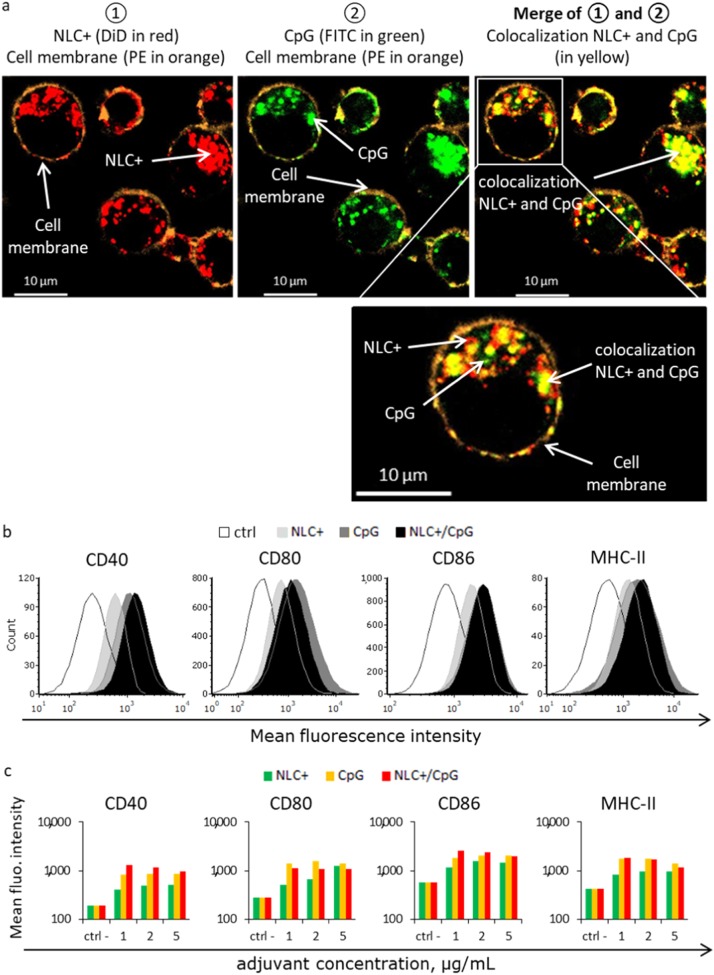
Fig. 3.
a Cellular localization of NLC+ /CpG after exposure of JAWS II DC for 1 h. Images were acquired by confocal microscopy. Red: NLC+ (DiD); green: CpG (FITC); orange: cell membrane (PE); Yellow: co-localization of NLC+ and CpG (merge of red and green). b Activation of DC by CpG formulations as measured based on the mean fluorescence intensity of activation markers CD40, CD80, CD86, and MHC-II after exposure to 2 µg/mL of CpG (and equivalent NLC+) and c 1, 2, 5 µg/mL of CpG (and equivalent NLC+) for 24 h

