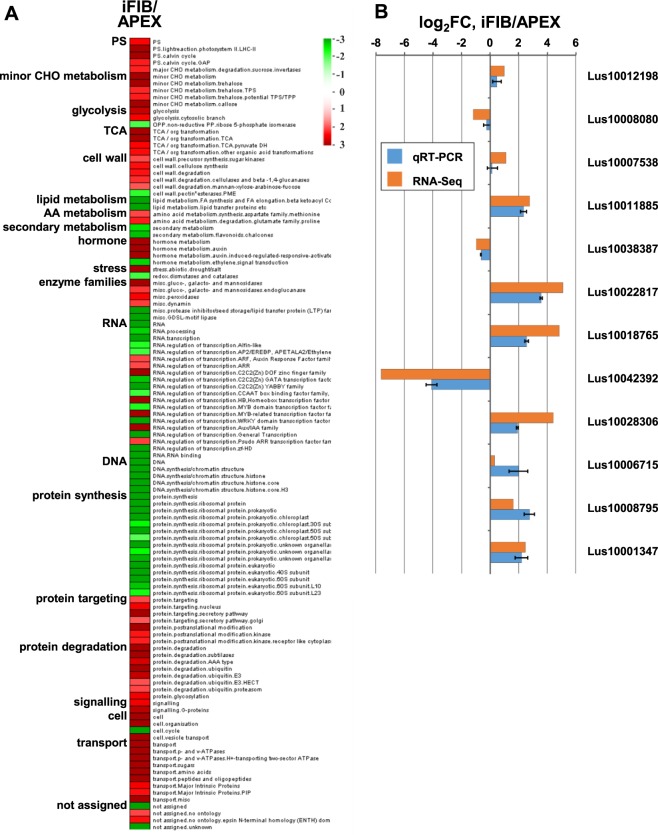
Figure 2.
(A) Overrepresentation analysis of up- and down-regulated genes within functional gene classes defined by MapMan bins (MapMan, v3.6.0RC1, available online at http://mapman.gabipd.org/web/guest/mapman [accessed on 29 June 2018]) in iFIB sample as compared to APEX (iFIB/APEX). The data were subjected to a Wilcoxon test; resulting p-values were adjusted according to Benjamini and Hochberg in PageMan (http://mapman.gabipd.org/pageman [accessed on 20 July 2018]), and the results are displayed in false color. Functional gene classes colored in red are significantly up-regulated, whereas ones colored in green are significantly down-regulated. PS, photosynthesis; TCA, tricarboxylic acid cycle; AA, amino acid; CHO, carbohydrate. (B) Verification of RNA-Seq expression through qRT-PCR, error bar shows the standard error of the mean.

