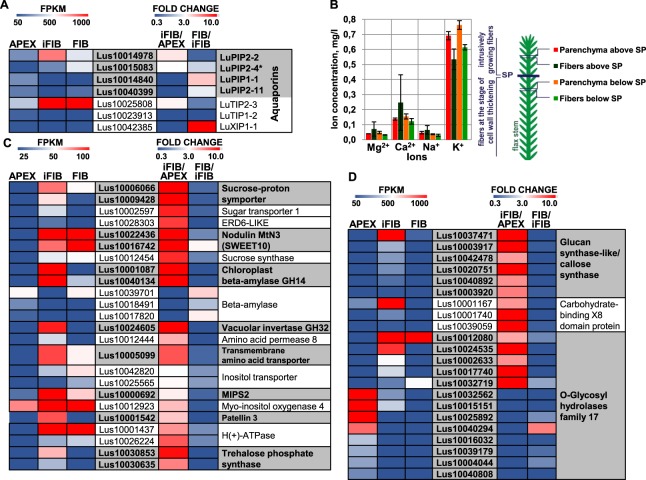
Figure 3.
(A) Transcriptional level of the differentially expressed in APEX and iFIB genes for aquaporins (PIPs and TIPs, annotated according to24 and Arabidopsis homology (*)). (B) The concentration of the ions Mg2+, Ca2+, Na+, and K+ in the cortex parenchyma cells and in the fibers above and below the snap point (SP). Ion concentration is expressed as per unit of the total microdissection area. Transcriptional level of the differentially expressed in APEX and iFIB genes for other proteins potentially involved in supplying assimilates, supporting turgor pressure, ion redistribution (C) and callose metabolism (D). The level of expression (FPKM) is shown on the left side of each panel, while the fold change between the samples is on the right side. The used cut-off was FPKM > 25 (in iFIB or in APEX). Only the genes with the fold change >3 (up-regulated) and with the fold change <0.33 (down-regulated) for iFIB/APEX are shown. Data for the fibers at an advanced stage of specialization (FIB) used for the comparison to determine the genes with a stage-specific character of expression were published previously12.

