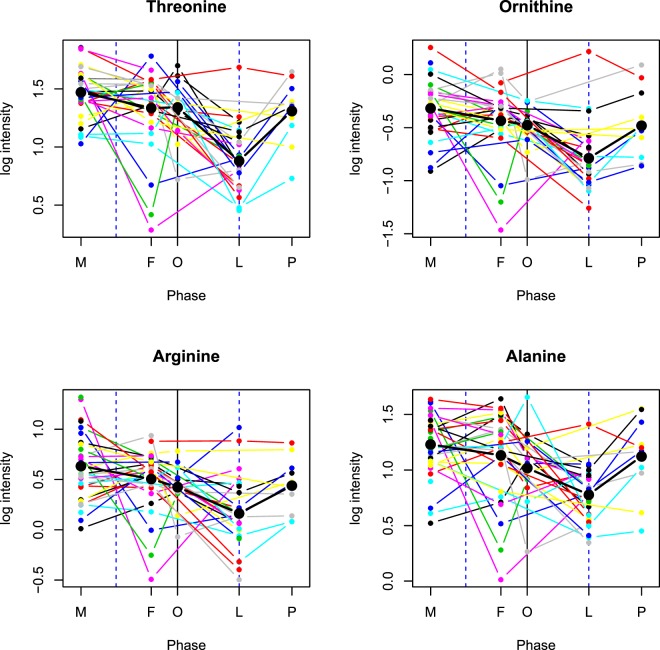
Figure 4.
Amino acid variability by cycle phase. Mean log intensity is depicted along with individual variability for threonine, ornithine, arginine, alanine, glycine, serine, methionine, asparagine, proline, glutamine, tyrosine, gamma-glutamyl-alanine, citrulline, o-acetyl-serine, alpha-aminobutyric acid, and gamma-glutamylglutamine at one time point for each of the 5 menstrual phases (M = menstrual, F = follicular, O = periovular, L = luteal, p = premenstrual). Each colored line represents an individual. Amino acids are depicted which have 2 or more contrast comparisons meeting the multiple testing threshold of q < 0.20. Statistically significant luteal phase reductions can be observed.

