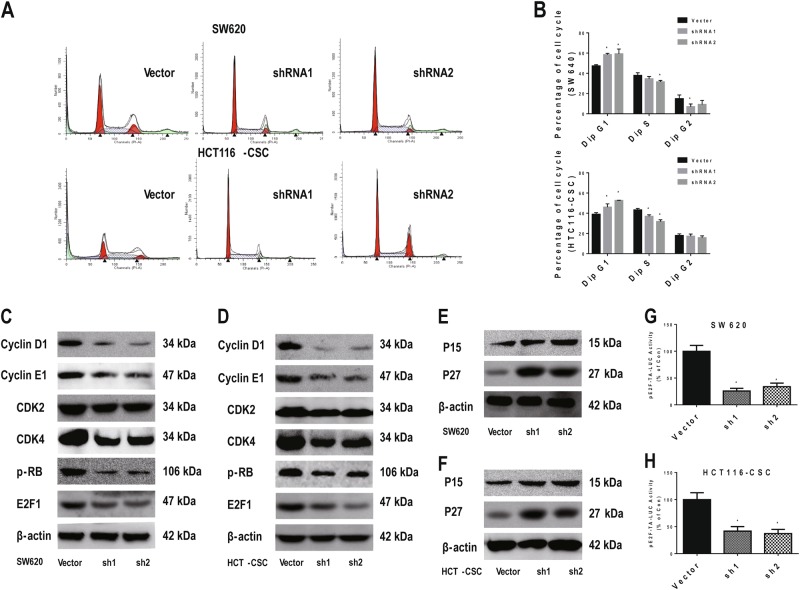
Fig. 3. FIBP knockdown inhibited the G1–S-phase transition in CRC cells.
a Representative cell cycle data for SW620 cells and HCT116-CSCs with/without FIBP knockdown. b Summary of the quantitative cell cycle analysis results in SW620 cells and HCT116-CSCs with/without FIBP knockdown. c, d Western blot results showing that the cyclin D1, CDK4, p-RB, and E2F1 levels were significantly decreased after FIBP knockdown in SW620 cells (c) and HCT116-CSCs (d). e, f The P15 and P27 levels were significantly increased after FIBP knockdown in SW620 cells (e) and HCT116-CSCs (f). g, h The luciferase activity driven by the E2F motif was significantly decreased after FIBP knockdown in SW620 cells (g) and HCT116-CSCs (h). *p < 0.05 compared with the Vector control group

