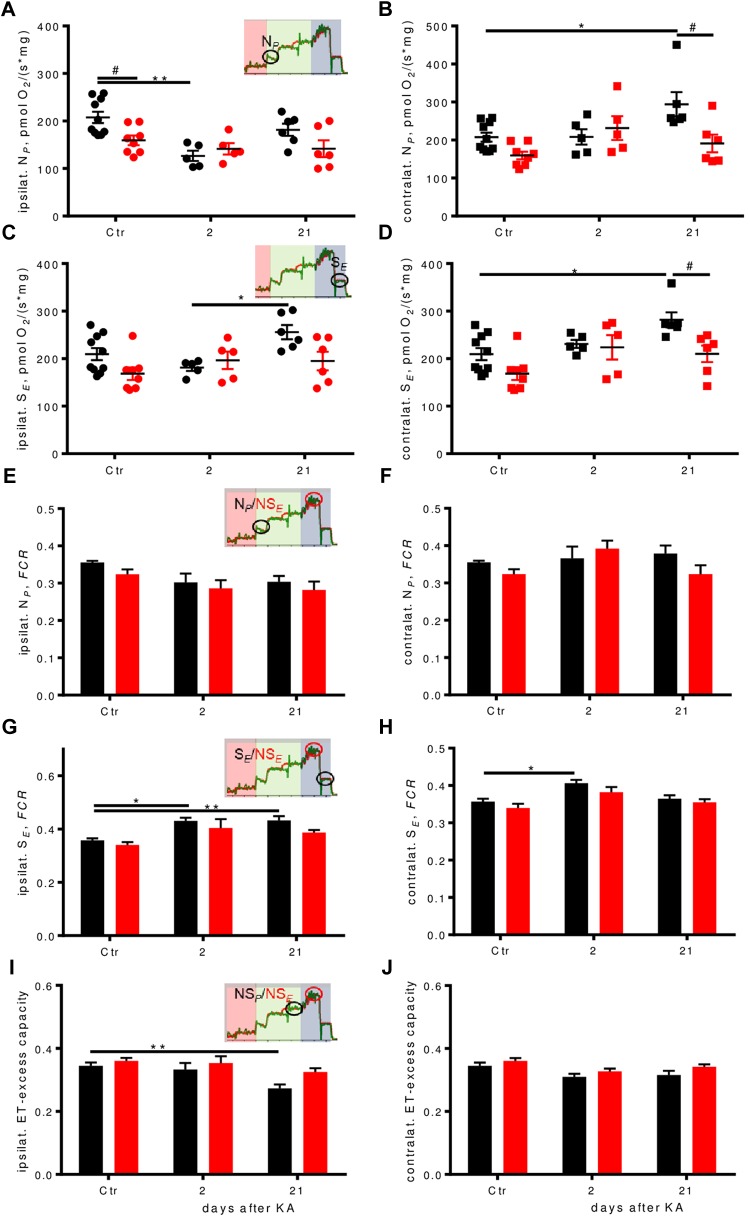
FIGURE 5.
Respiration pathways are differentially affected during epileptogenesis. (A–D) Ipsilateral absolute depression in early epileptogenesis and contralateral absolute respirational increase in WT is absent in Enk-/- (KO) mice. NP-(A,B), and SE-(C,D) respiration per mg protein of ipsilateral and contralateral dorsal hippocampi. Interaction/time/genotype statistics: F(2,34) = 3.08, P = 0.059/F(2,34) = 7.11, P = 0.003, F(1,34) = 5.03, P = 0.032 for (A), F(2,34) = 3.99, P = 0.028/F(2,34) = 4.79, P = 0.015/F(1,34) = 6.25, P = 0.017 for (B), F(2,34) = 2.87, P = 0.070/F(2,34) = 3.81, P = 0.032/F(1,34) = 5.34, P = 0.027 for (C), and F(2,34) = 1.73, P = 0.193/F(2,34) = 7.67, P = 0.002/F(1,34) = 9.18, P = 0.005 for (D). (E–J) Flux control ratios (FCRs) in WT, but not in Enk-/- (KO) mice change across epileptogenesis. NP FCR (E,F) remains similar across epileptogenesis and genotypes, SE FCR (G,H) is increased in epileptogenesis in WT. Apparent electron transfer-excess capacity decreases in WT in late epileptogenesis ipsilaterally (I), but not contralaterally (J) or in KO. Interaction/time/genotype statistics: F(2,34) = 0.124, P = 0.883/F(2,34) = 6.41, P = 0.004/F(1,34) = 3.03, P = 0.091 for (E), F(2,34) = 2.18, P = 0.129/F(2,34) = 2.35, P = 0.110/F(1,34) = 1.76, P = 0.193 (F), F(2,34) = 0.50, P = 0.610/F(2,34) = 14.50, P < 0.001/F(1,34) = 5.73, P = 0.022 for (G), F(2,34) = 0.21, P = 0.815/F(2,34) = 10.34, P < 0.001/F(1,34) = 4.17, P = 0.049 for (H), F(2,34) = 1.05, P = 0.360/F(2,34) = 8.69, P < 0.001/F(1,34) = 6.47, P = 0.016 for (I), and F(2,34) = 0.142, P = 0.868/F(2,34) = 5.60, P = 0.008/F(1,34) = 4.74, P = 0.037 for (J). ∗ and # indicate a p-value < 0.05, ∗∗p-value < 0.01.

