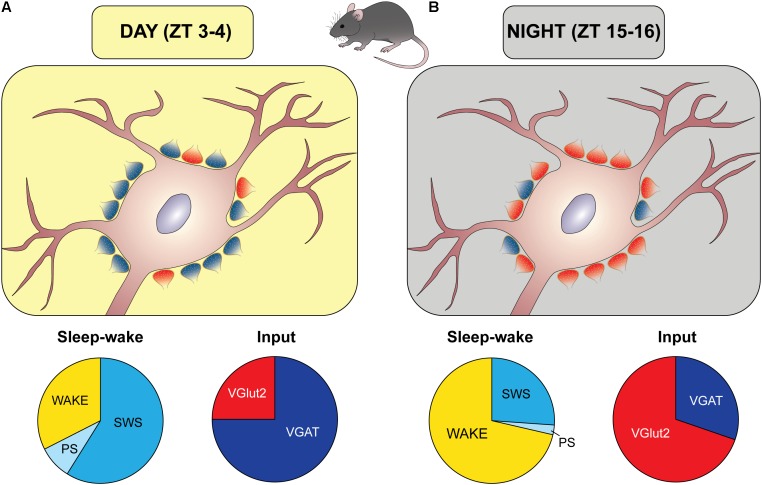
FIGURE 2.
Diurnal remodeling of the excitatory/inhibitory input to orexin cell bodies. Schematic representation of synaptic organization (excitatory/inhibitory balance) during the light period (A) and the period of darkness (B), based on the results by Laperchia et al. (2017) in mice. Zeitgeber time (ZT) 0 corresponds to the lights-on time. During the day (A) there was a prevalence of inhibitory synapses (blue boutons), as determined by immunopositivity to the presynaptic vesicular GABA transporter (VGAT) and postsynaptic gephyrin, when matched mice spent most of this time asleep (slow wave sleep, SWS, and paradoxical sleep, PS), as depicted by the apple-pie chart. An opposite arrangement was found during the night, when excitatory synapses (red boutons), as determined by immunopositivity to the presynaptic vesicular glutamate transporter (VGluT)2 and postsynaptic density protein 95 (PSD95), prevailed, and matched mice spent most of this period awake.

