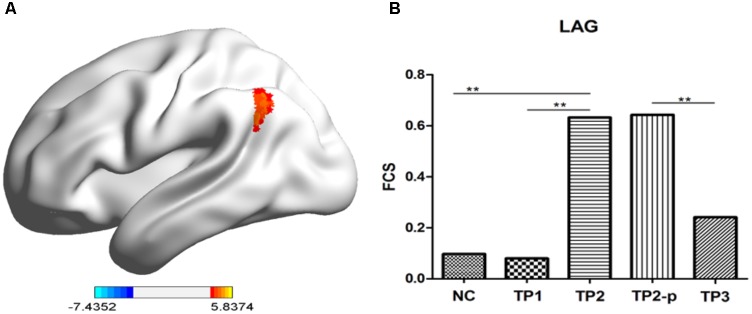
FIGURE 2.
(A) The stereogram of LAG. (B) The FCS value of LAG in each group. The Functional connectivity strength (FCS) values of left angular gyrus in normal controls and depression patients. NC, normal controls; TP1, patients at 12–24 h before the first ECT administration; TP2, patients at 24 h-1 week after the last ECT administration; TP2_p, patients at TP2 who completed the sacn of TP3; TP3, patients at about 1 month after the last ECT administration; LAG, left angular gyrus. ∗p < 0.05; ∗∗p < 0.01.

