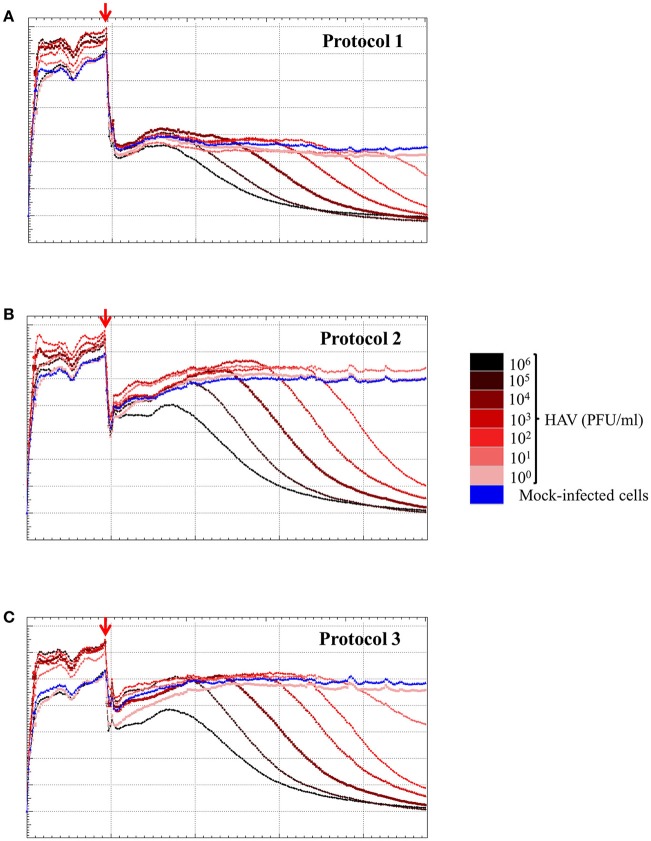
Figure 6.
HAV infection induces a dose-dependent effect as measured by the RTCA assay. Kinetic curves of CI values in FRhK-4 cells uninfected (blue) or infected with different amounts of HAV [from 105 PFU/well (black) to 0.1 PFU/well (pink)] using protocol 1 (A), protocol 2 (B), and protocol 3 (C). The red arrows indicate the time after which HAV was added on sub-confluent monolayers of FRhK-4 cells.

