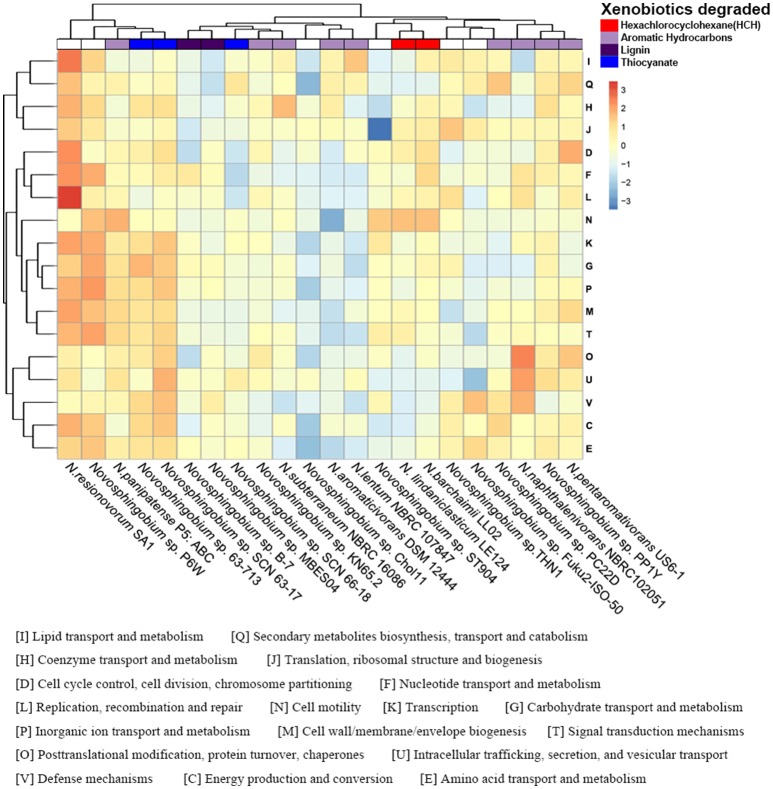
Figure 3.
Functional profiling of the Novosphingobium genomes. Heatmap showing the normalized relative abundance of the clusters of orthologous groups (COG) categories enriched in the protein-coding genes in the 22 Novosphingobium genomes. The strains and COG categories were clustered using the Euclidean distance. The color scale represents the relative abundance of gene content for each category, normalized by sample mean.

