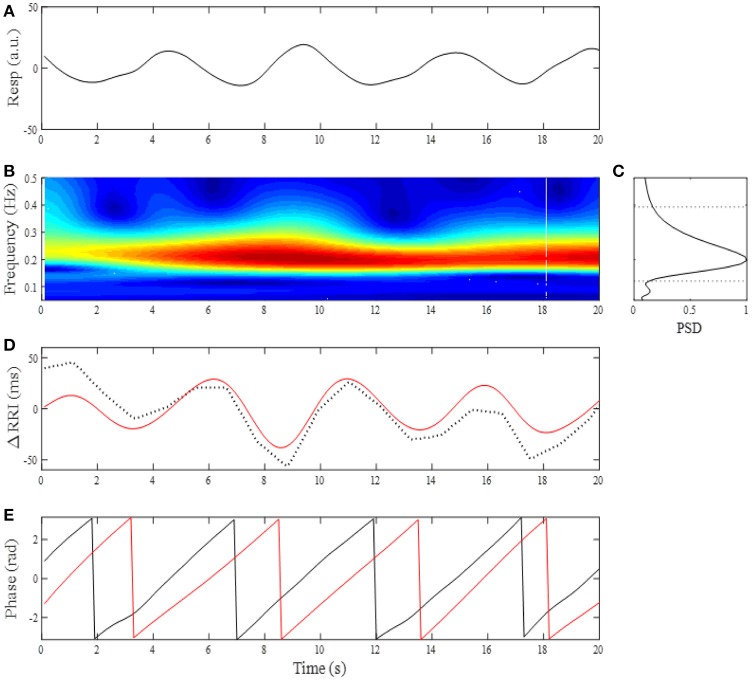
Figure 1.
(A) Changes in breathing trace (Resp, upward deflections denote expiration) for a 20-s time window. (B) Time-frequency representation by CWT for breathing. (C) Mean power spectral density (PSD) profile in the normalized form. The corner frequencies of passband filter for determining RSA were estimated by the frequencies where PSD reduced to 20% of its maximum power (horizontal dotted lines). (D) Change in RRI (dotted curve) and extracted RSA (red curve). (E) Instantaneous phases for breathing (black line) and RSA (red line).

