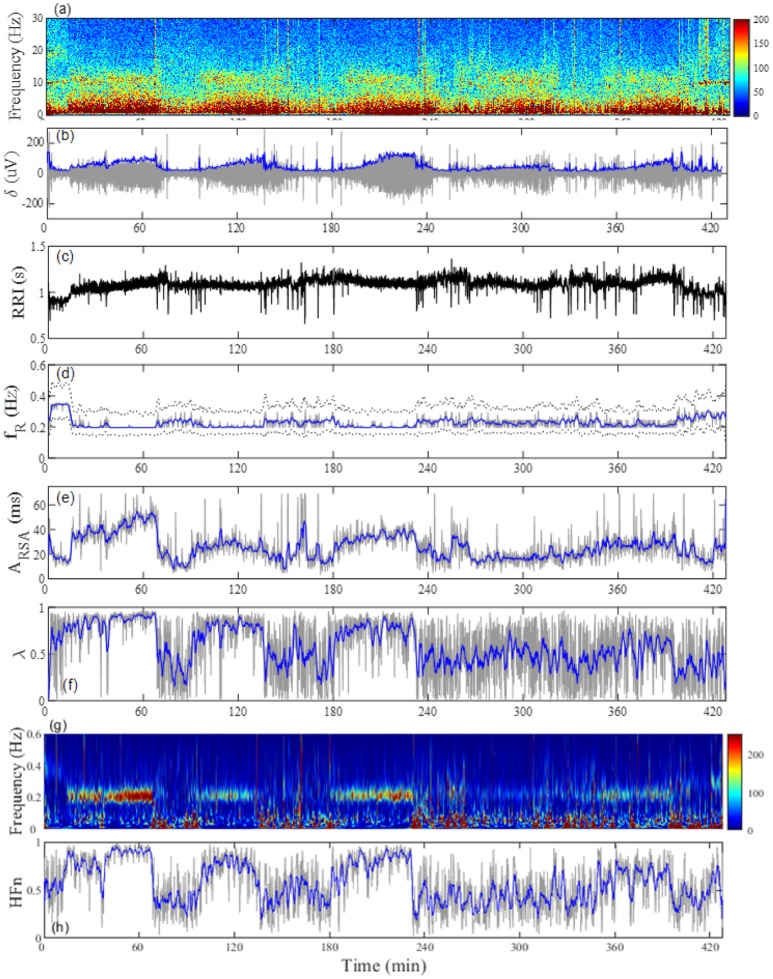
Figure 2.
Representative profiles of the (A) EEG frequency decomposition, (B) extracted EEG δ-wave, (C) RRI, (D) breathing frequency (fR), (E) amplitude of respiratory sinus arrhythmia (ARSA), (F) phase coherence (λ) between RSA and respiration, (G) time-frequency representation (TFR) for the change in RRI by using a continuous wavelet transform, and (H) normalized high-frequency component (HFn) of RRI fluctuation estimated from TFR in a 24-year-old man. The gray line in (B) indicates the amplitude of the EEG δ-wave and the blue line depicts the envelope. The dotted lines in (D) indicate the full width at 20% maximum of the power spectral density for breathing, which was used as the passband frequency for determination of RSA. The gray lines in (D–F,H) are respective values estimated from 20-s windows and the blue lines indicate general trends obtained by applying a median filter (2-min moving window).

