Figure 4.
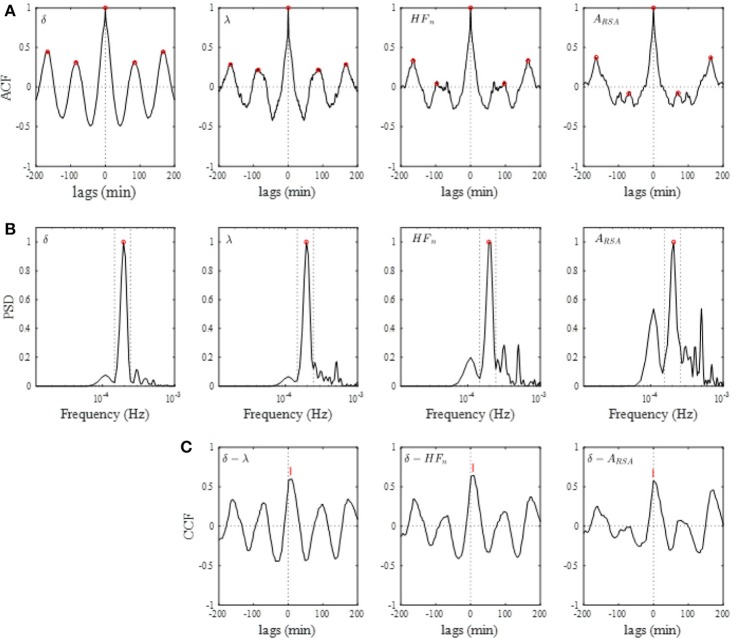
(A) Auto-correlation functions (ACFs) of brain δ-wave, λ, normalized high-frequency component of HRV (HFn), and amplitude of RSA (ARSA), calculated from the entire night of sleep. Open red circles indicate peaks of ACF. (B) Normalized power spectral densities (PSDs) for the respective ACF. Open red circle, detected maximal peak; vertical dotted lines, ± 25% of the peak frequency. (C) Cross-correlation functions (CCFs) between δ-wave and λ, between δ-wave and HFn, and between δ-wave and ARSA. The lag time at which CCF attains its maximum is indicated by a red vertical bar in each CCF.

