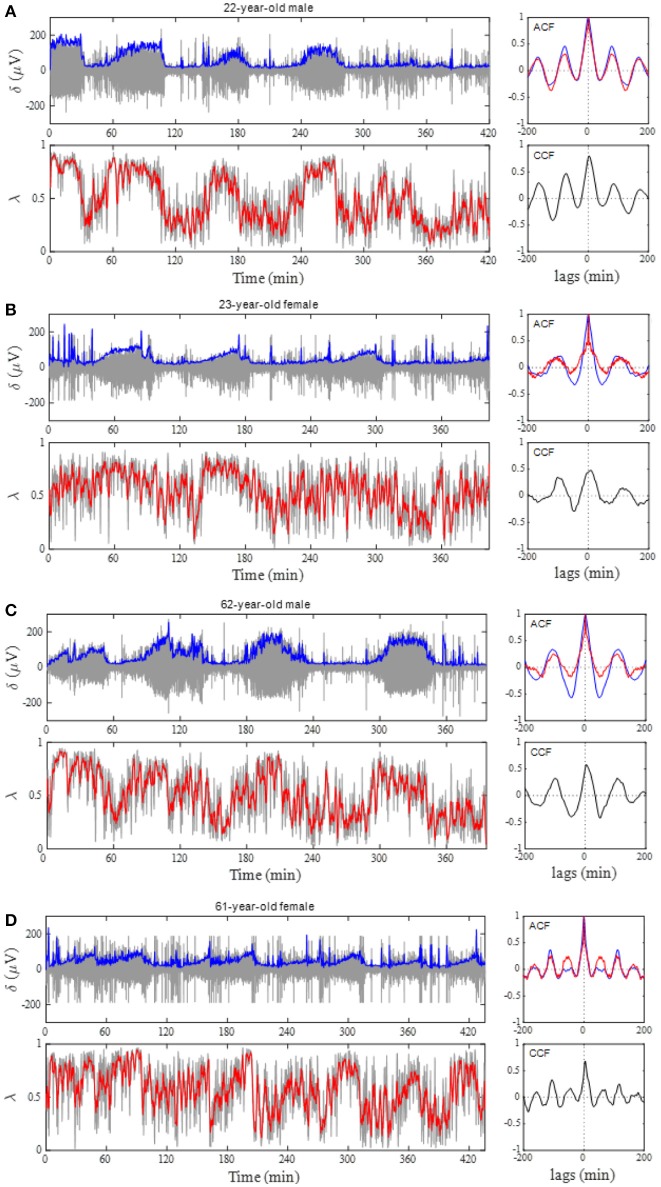
Figure 5.
Phase coupling analyses for male and female subjects of different ages. (A) 22-year-old man, (B) 23-year-old woman, (C) 62-year-old man, and (D) 61 year-old woman. Profiles of the EEG δ-wave and phase coherence (λ) for the whole night are shown, together with their respective autocorrelation function (ACF) and cross-correlation function (CCF) between these two signals. Blue and red curves in the ACF panel indicate ACF for the δ-wave and λ, respectively. Depicted in the gray and blue in δ-wave panel show an extracted δ-wave and its envelope, respectively. Computed λ from 20-s windows shows in gray line and the red indicates general trend obtained by applying a median filter (2-min moving window).

