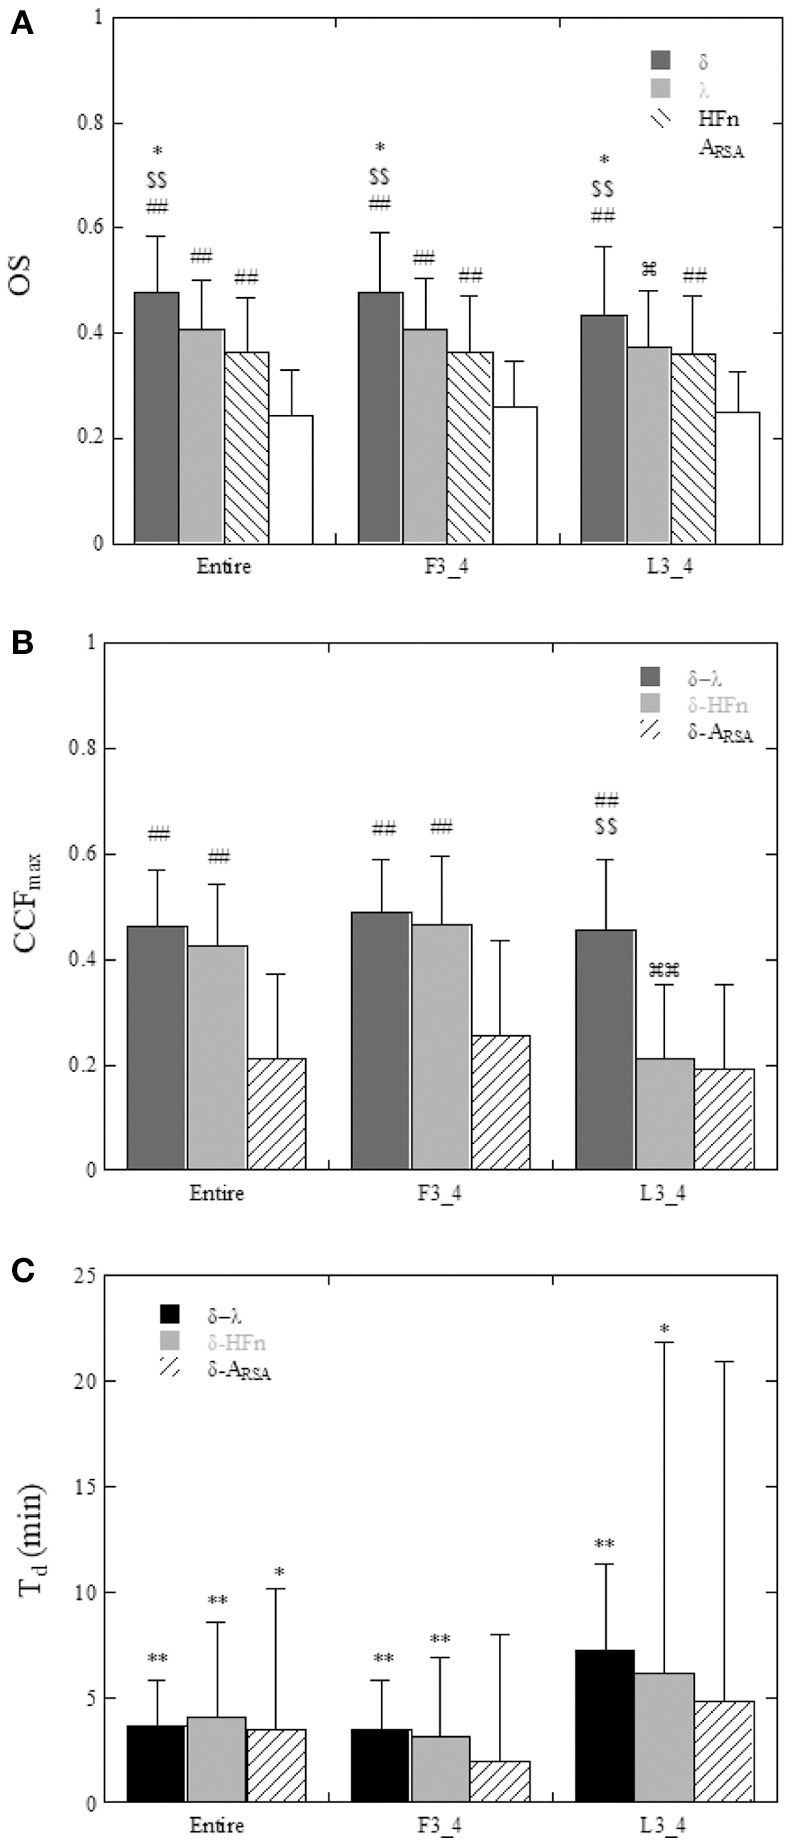
Figure 6.

(A) Comparison of the oscillation strength (OS) of the ACF of δ-wave, λ, HFn, and ARSA calculated for the entire night (Entire), the first three quarters (F3_4), and last three quarters (L3_4) of the sleep period. *P < 0.05 vs. λ, $$P < 0.01 vs. HFn, ##P < 0.01 vs. ARSA,  P < 0.05 vs. Entire and F3_4. (B) Maximum values of the cross-correlation function (CCFmax) between δ-wave and λ, between δ-wave and HFn, and between δ-wave and ARSA. ##P < 0.01 vs. δ-ARSA, $$P < 0.01 vs. δ-HFn,
  P < 0.01 vs. Entire and F3_4. (C) Time delay (Td) of the δ-wave from the changes in λ, HFn, and ARSA. Statistical comparison of Td was performed with the null hypothesis of a zero time delay for each variable. *P < 0.05, **P < 0.01.
