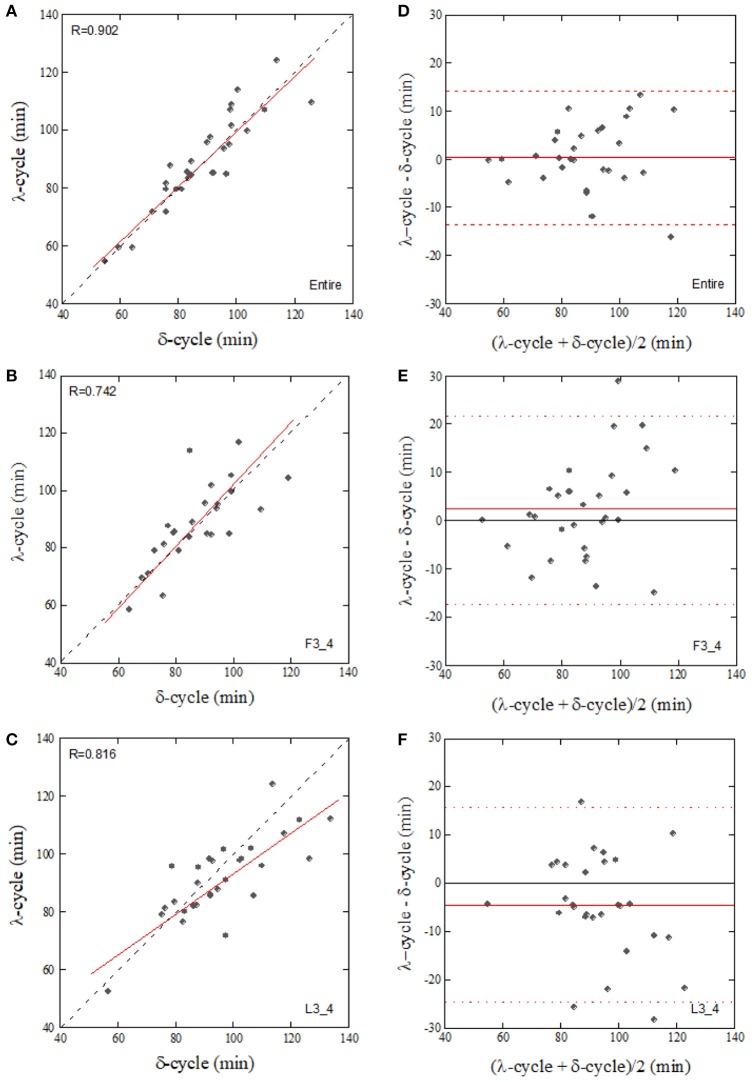
Figure 7.
Correlation of the sleep-cycle estimated from δ-wave and λ ACFs calculated from the entire (A, Entire), first three-quarters (B, F3_4), and last three-quarters (C, L3_4) of the sleep period and their Bland-Altman plots (D–F). The dotted and solid lines in (A–C) represent the identity line and linear regression line, respectively. Horizontal broken lines in (D–F), upper and lower limits of agreement (+2 SD and −2 SD, respectively), Solid lines in (D–F), mean value of the difference.

