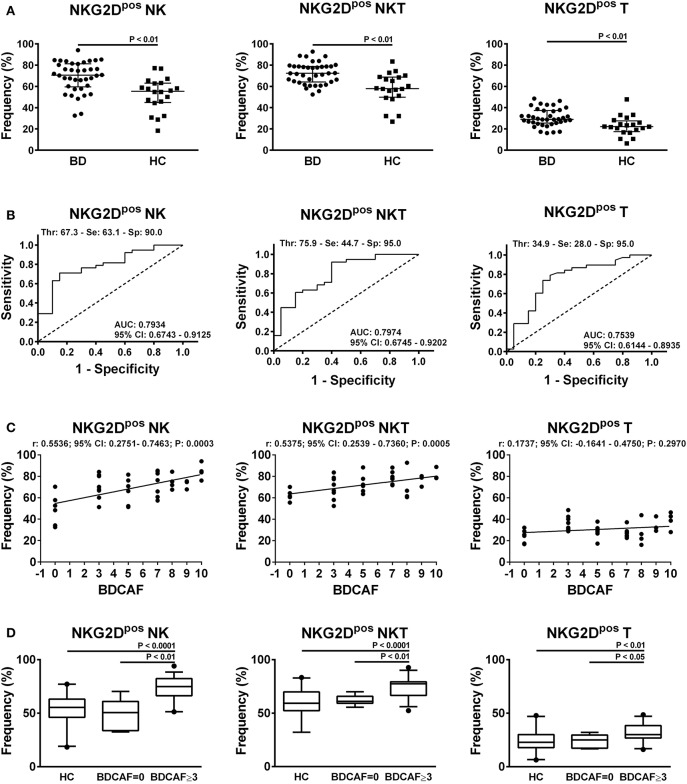
Figure 2.
NKG2D expression in lymphocytes from BD patients and HC. (A) Dot plot visualization of the percentages of NKG2Dpos cells in the NK, NKT, and T lymphocyte gate determined by flow cytometry in PBMCs from BD patients ( ) and HC (■). Horizontal lines show the median ± IQR. Data were analyzed by Mann-Whitney U test. (B) ROC curve analysis of the percentages of NKG2Dpos cells in NK, NKT, and T lymphocyte gates. AUC, Area Under the Curve; CI, Confidence Interval; Thr, Threshold; Se, Sensitivity; Sp, Specificity. (C) Dot plot visualization of the correlation between the frequencies of NKG2Dpos NK, NKT, and T cells and BDCAF scores for each BD patient. Data were analyzed by Spearman's correlation test (n = 38). (D) Box plot visualization of the frequencies of NKG2Dpos NK, NKT, and T cells in BD patients with BDCAF = 0 vs. BDCAF ≥ 3 and HC. Data were analyzed by Mann-Whitney U test.

