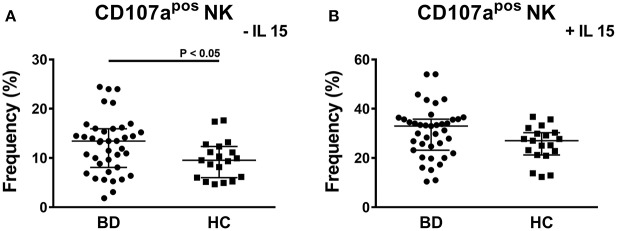
Figure 5.
CD107a degranulation assay of PBMCs from BD patients and HC. Dot plot visualization of the percentages of CD107apos cells in the NK lymphocyte gate determined by flow cytometry in PMBCs from BD patients ( ) and HC (■) after stimulation with K562 in presence of 10 μg/mL brefeldin A and 6 μg/mL monensin. The assay was conducted without (A) or with 1ng/mL IL-15 (B) to maximize the stimulus. Horizontal lines show the median ± IQR. Data were analyzed by Mann-Whitney U test.

