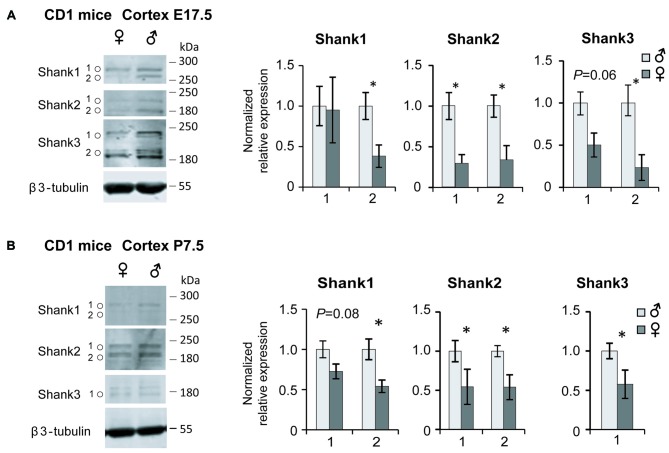
Figure 4.
Shank protein analysis in the male and female mouse cortex. Levels of Shank1, Shank2 and Shank3 protein in the frontal cortex of male and female at E17.5 (A) and P7.5 (B); (n = 4 of each sex), *P < 0.05, unpaired two-tailed Student’s t-tests. Isoform expression differences were observed between the two developmental stages for Shank3.

