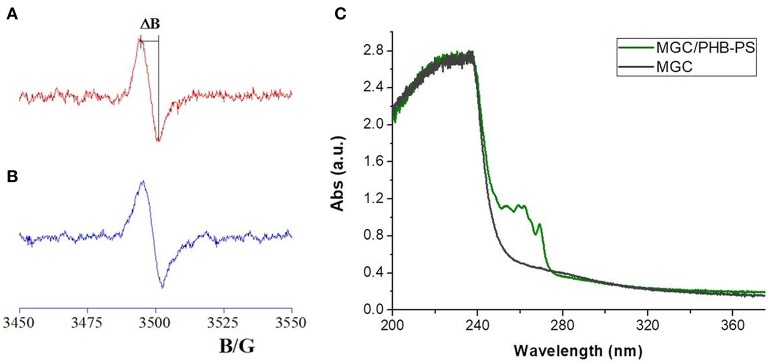
Figure 2.
EPR spectra of MGC powder (A) and electrospun mats (B). ΔB corresponded to the distance between the maximum and the minimum within the spectra. On the right (C) the UV-vis adsorption spectra of diluted polymer mixture of MGC/PHB-PS (light green) and diluted Sol2 in chloroform (dark green) are reported.

