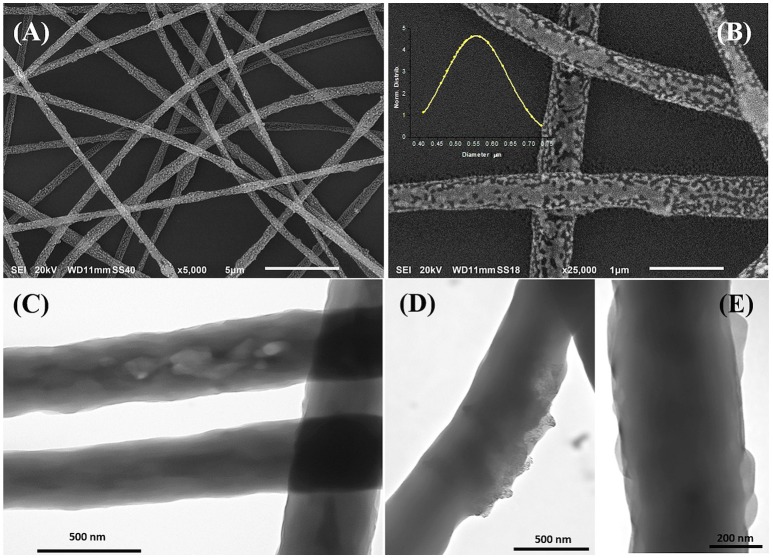
Figure 3.
SEM (A,B) and TEM (C–E) micrographs of electrospun fibers at different magnifications. The inset in Figure B represents the diameter distribution of the fibers collected from the SEM micrographs. SEM micrographs showed cavities and roughness on the surface while TEM highlighted protrusions (E), zones with different density (C), and the MGC particles finely dispersed within the matrix (D).

