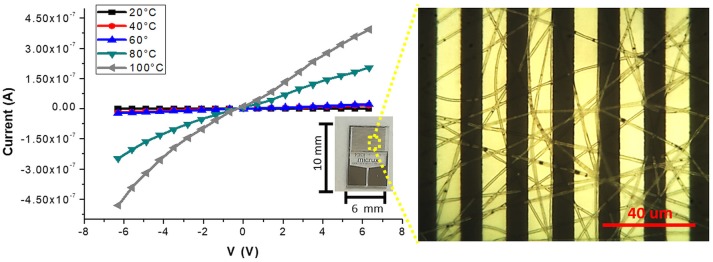
Figure 4.
Current-Voltage curves at different temperatures (20, 40, 60, 80, 100°C) for the fibers coated IDE (inset) are plotted. On the right, an optical micrograph shows a homogeneous coverage of the transparent fibers onto the interdigitated platinum bars. The optical image highlighted the presence of sub-micrometric MGC clusters.

