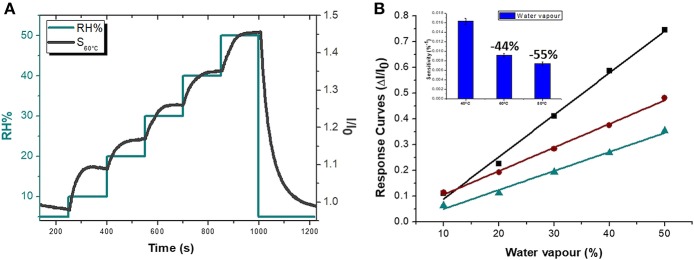
Figure 6.
Sensor electrical features at 60°C (S60°C) in dependence on %RH: the Normalized current curves (I/I0, black) and Relative Humidity percentage (green) VS time are depicted (A). Sensor Response Curves VS Relative Humidity percentage at 40, 60, 80°C (green, brown and black, respectively) with an inset showing the Sensitivity values at 40, 60 and 80°C are reported.

