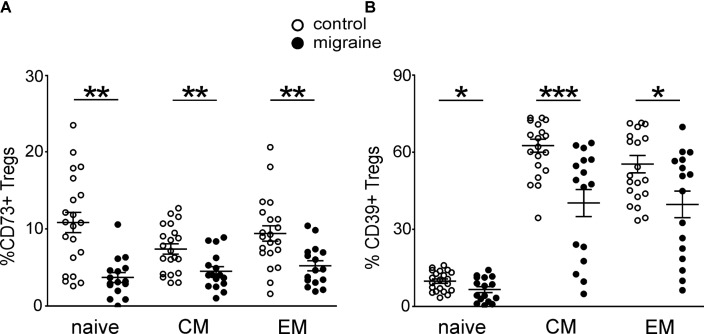
FIGURE 3.
CD73 and CD 39 expression by Treg subsets gated based on CD45R0 and CD62L expression in healthy controls (white, n = 21) and migraine patients (black, n = 16). (A) Percentages of CD73-positive cells within “naïve” (CD45R0-CD62L+), central memory (CD45R0+CD62L+), and effector memory (CD45R0+CD62L-) Tregs. (B) Percentages of CD39-positive cells within “naïve” (CD45R0-CD62L+), central memory (CD45R0+CD62L+), effector memory (CD45R0+CD62L-) Tregs. Horizontal lines indicate mean ± SEM. The differences between the groups are shown according to non-parametric Mann-Whitney test (∗p < 0.05, ∗∗p < 0.01, ∗∗∗p < 0.001).

