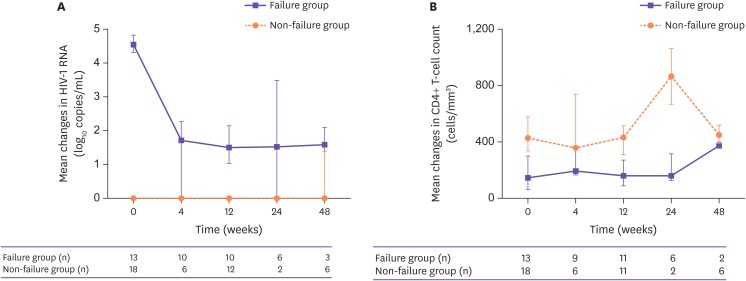
Figure 2. Mean changes in HIV RNA titer (A) and CD4+ T cell count (B). In the failure group (purple line), suppression of the HIV RNA titer decrease is shown and CD4+ T cell count increased. In the non-failure group (orange line), virus suppression and high CD4+ T cell levels are maintained.
HIV, human immunodeficiency virus; RNA, ribonucleic acid.

