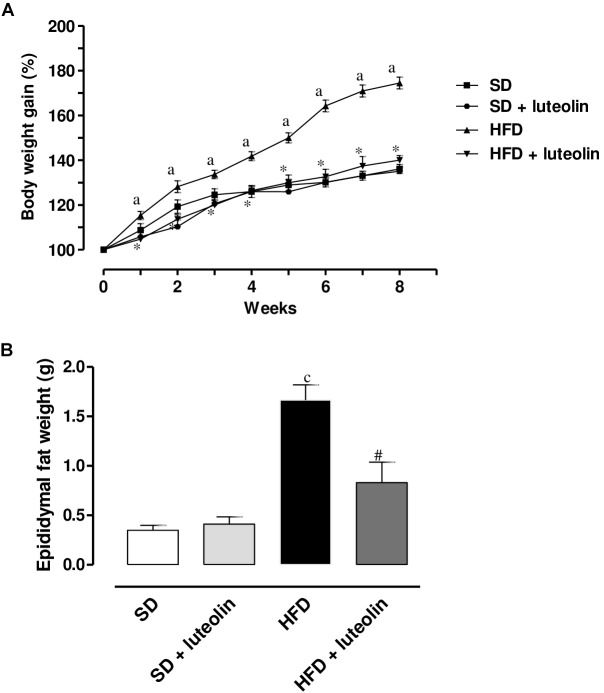
FIGURE 1.
(A) Body weight gain (%) in mice fed with SD, SD plus treatment with luteolin (10 mg/Kg/day), HFD or HFD plus treatment with luteolin (10 mg/Kg/day) for 8 weeks. Each point represents the mean ± SEM of five animals. aP < 0.05 significant difference vs. SD at the respective week; ∗P < 0.05 significant difference vs. HFD at the respective week. (B) Epididymal fat weight in mice fed with SD, SD plus treatment with luteolin (10 mg/Kg/day), HFD or HFD plus treatment with luteolin (10 mg/Kg/day) for 8 weeks. Each column represents the mean ± SEM of five animals. cP < 0.001, significant difference vs. SD; #P < 0.001 significant difference vs. HFD. Statistics: two-way analysis of variance followed by Newman–Keuls test.

