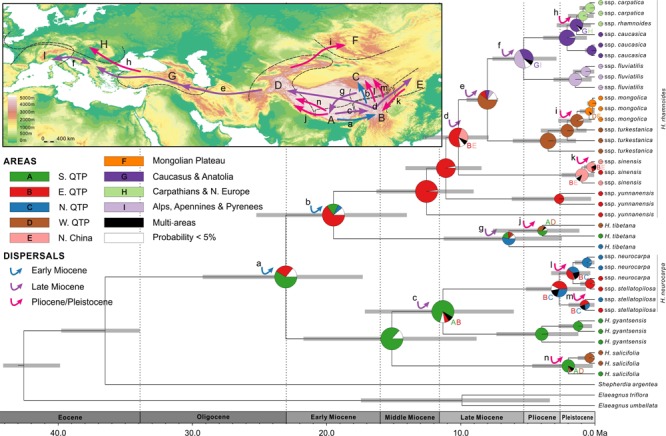
FIGURE 5.

Combined chronogram and biogeographical analysis of Hippophae L. based on nDNA data. Divergence times were derived from Bayesian analysis treating priors on fossils as being drawn from a lognormal distribution. Gray bars represent 95% credible intervals. Node charts show the marginal probabilities of alternative ancestral distributions from Bayesian dispersal-vicariance analysis (Bayes-DIVA) implemented in RASP. Multiple area distributions were labeled with respective colored characters. The detected dispersal events by Bayes-DIVA analysis are shown with colorful arrows on the chronogram and map. See Table 3 for age and probability estimates of the inferred dispersals.
