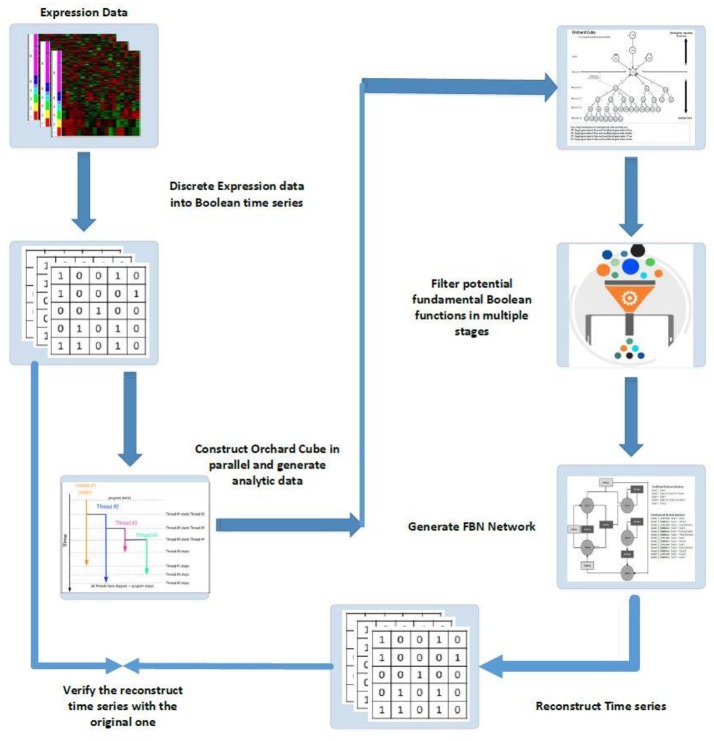
Figure 6.
Schematic diagram of FBN modeling and network inferences: (1) discrete expression data into Boolean time series; (2) construct orchard cubes in parallel to generate analytical data and store all precomputed measures; (3) mine potential regulatory rules for all target genes through the constructed orchard cube based on some criteria; (4) generate the fundamental Boolean network; (5) use the generated network to reconstruct the input time series by giving the initial states of all original inputs and; (6) verify the reconstruction time series with the original series, if necessary, to gain confidence in the results.

