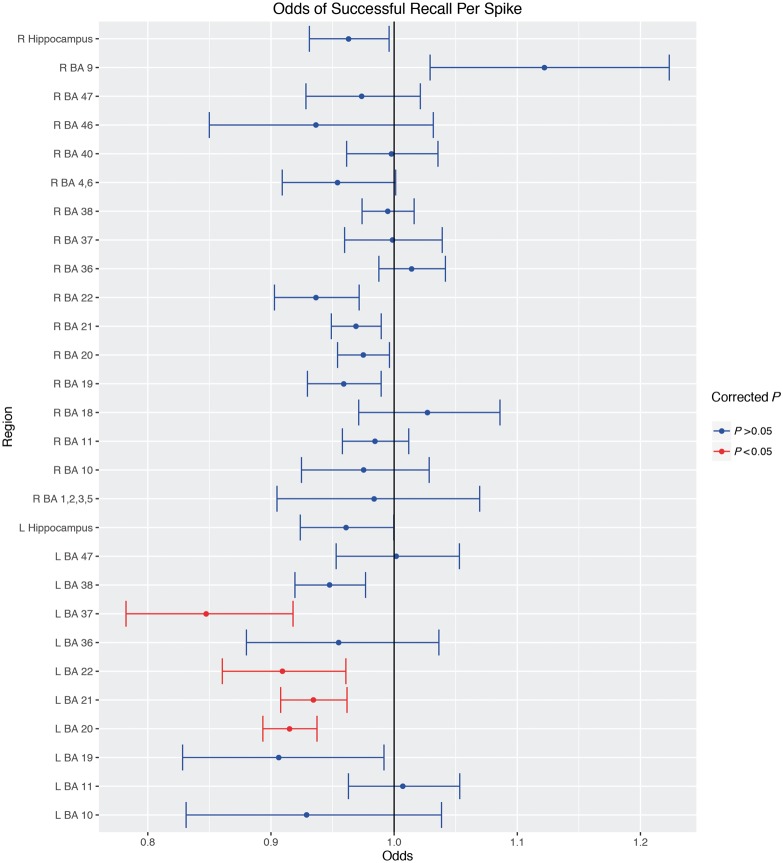
Figure 3.
Estimated odds of successful recall for each region. Mean odds of successful recall per spike during the encoding period are shown along with 95% CIs. Odds <1 indicate a decrease in the odds of successful recall per spike. Red indicates significant after multiple comparisons correction. L/R = left/right hemisphere.

