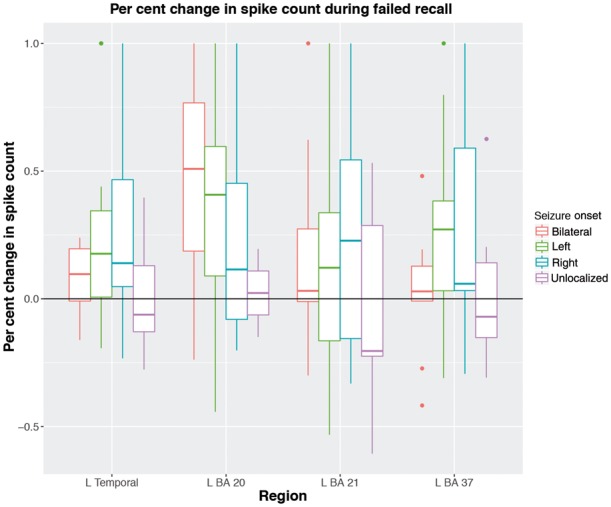
Figure 4.

Per cent change in spike count during failed encoding for each patient. Vertical axis represents the per cent change in spike count. The horizontal axis represents the left temporal lobe as well as the significant left temporal regions from our regional analysis. Boxplots represent the percent change of spikes across all patients with the given SOZ lateralization. Only the recall of words in serial position >5 were included to account for the primacy effect.
