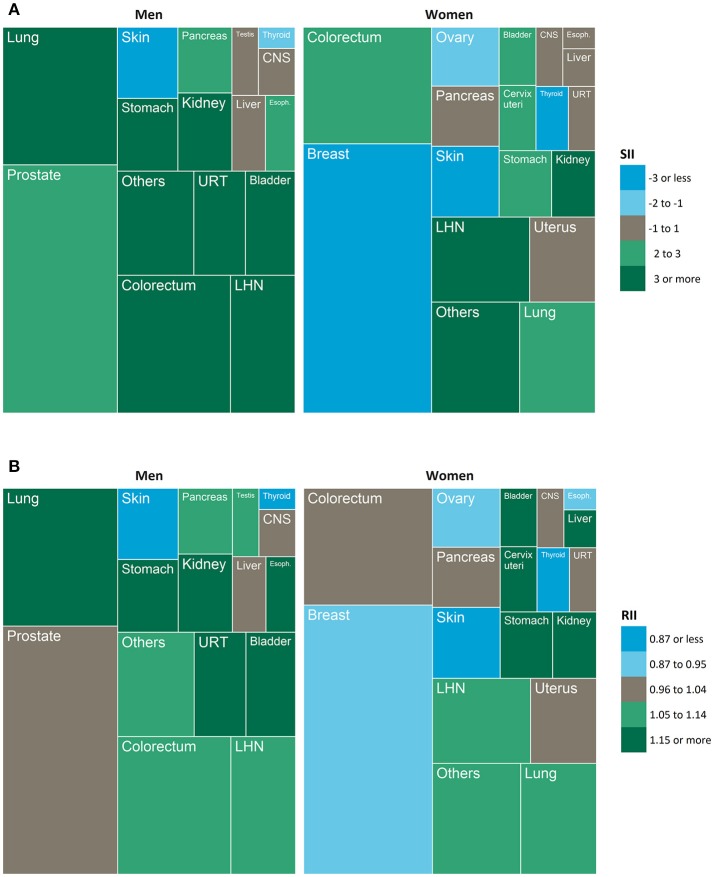
Figure 2.
Treemaps showing the proportion of all incident cancers diagnosed at each specific site (box size) in combination with the magnitude and direction of a) absolute inequality and b) relative inequality (color). SII, slope index of inequality, RII, relative index of inequality; CNS, central nervous system; URT, upper respiratory tract; LHN, lymphoid and hematopoietic neoplasms; Esoph., esophagus.

