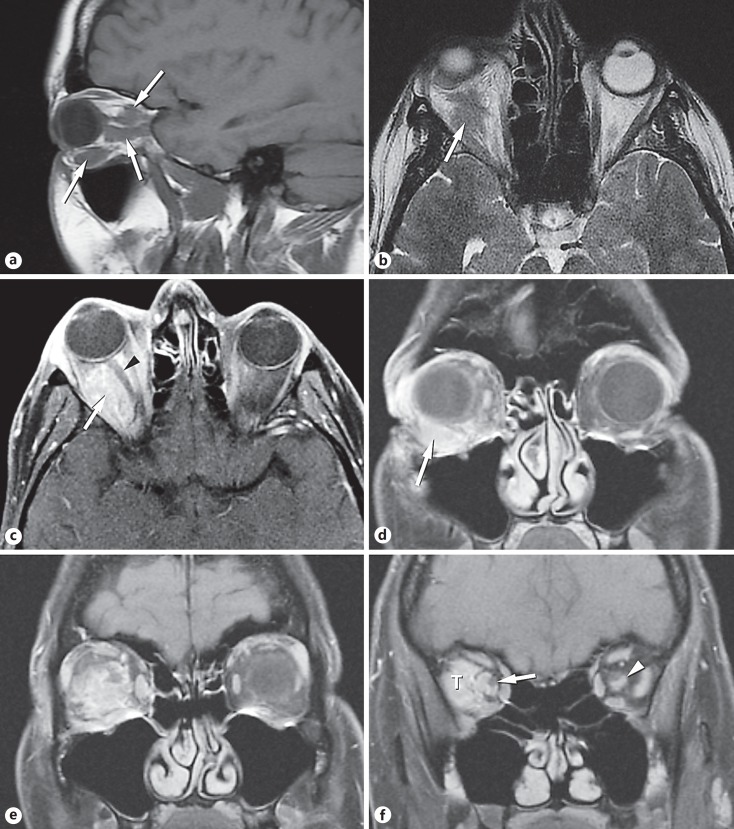
Fig. 2.
Magnetic resonance imaging. a The sagittal T1-weighted image showed multiple foci of abnormal signal (arrows) contrasted against the adjacent fat. b The axial T2-weighted image showed iso- to low-signal intensity (arrow). c The axial post-gadolinium fat-suppressed image showed the enhancing lesion (arrow) filling much of the orbit and slightly displacing the optic nerve (arrowhead). d Coronal T1-weighted image of the anterior orbit with fat suppression after gadolinium administration. The enhancing lesion (arrow) was located inferior to the globe, displacing it superiorly. Note how the lesion molded to the wall of the globe. e Coronal T1-weighted image, post contrast, fat-suppressed just posterior to Figure 1d. The lesion enhanced and appeared to wrap partially around the optic nerve. The shape of the lesion reflected the orbital fascial layers. f Coronal T1-weighted image, post contrast, fat-suppressed image just posterior to Figure 1e. The enhancing tumor (T) filled the lateral compartment of the orbit. The tumor also extended along the optic nerve sheath. The nerve (arrow) was visualized partially surrounded by the lesion. This appearance is most commonly seen in meningioma. A small lesion (arrowhead) was present in the contralateral nerve sheath.

