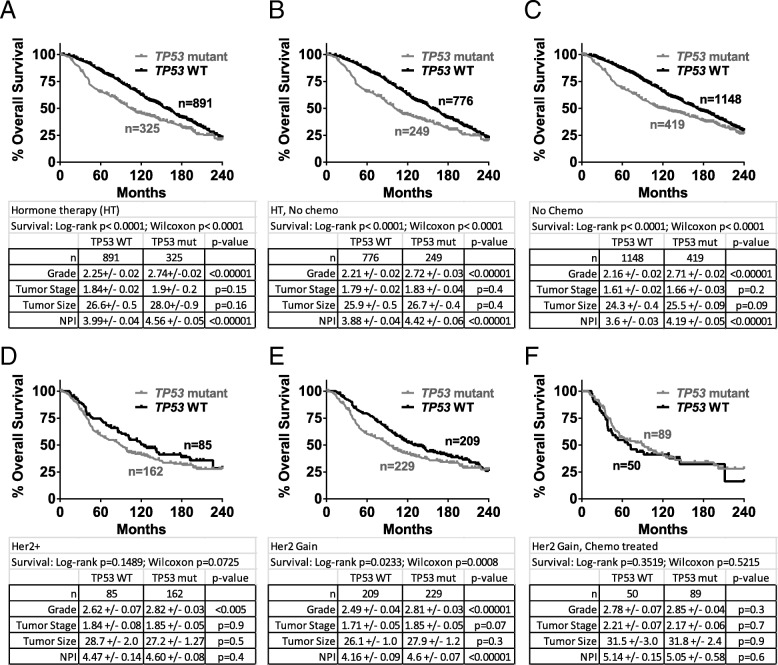
Fig. 2.
TP53 mutation portends worse 5-year overall survival for patients who received hormone therapy, and those who received no chemotherapy. Overall survival curves were created for patients with TP53 wild-type and mutant tumors from cohorts who (a) received hormone therapy; (b) received hormone therapy but not chemotherapy; (c) did not receive chemotherapy. Overall survival curves were created for patients with TP53 wild-type and mutant tumors from cohorts who (d) were HER2+; (e) were classified as HER2 gain; (f) were classified as HER2 gain and received chemotherapy. Statistical differences in survival curves were calculated using both the Wilcoxon test (weighs early events more heavily) and log-rank (Mantel-Cox) tests (weighs events evenly over time). Shown below each survival curve is a table containing the sample size in each arm, the mean +/− SEM and p value (unpaired, two-tailed Student’s t test) for tumor histological grade, tumor stage, tumor size, and Nottingham Prognostic Index

