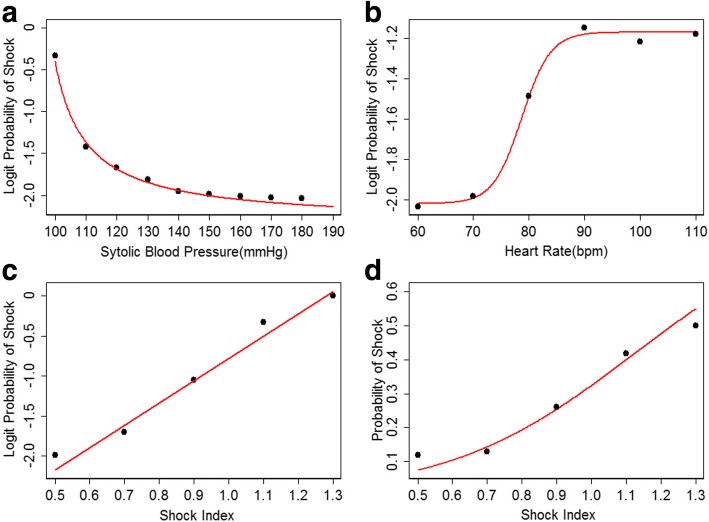
Fig. 1.
(a) The logit probability of developing CS showed inverse proportional to the pre-procedural SBP. (b) The relationship between pre-procedural HR and logit probability of developing CS formed a sigmoid curve. (c) The logit probability of developing CS was positive linear correlated to the SI. (d) The relationship between probability of developing CS and SI was fitted into a logistic function. The curve shown in the graph was just at the rapid descending part of the logistic curve, which was very close to a line. SBP: systolic blood pressure; HR: heart rate; SI: shock index; CS: cardiogenic shock

