Fig. 2.
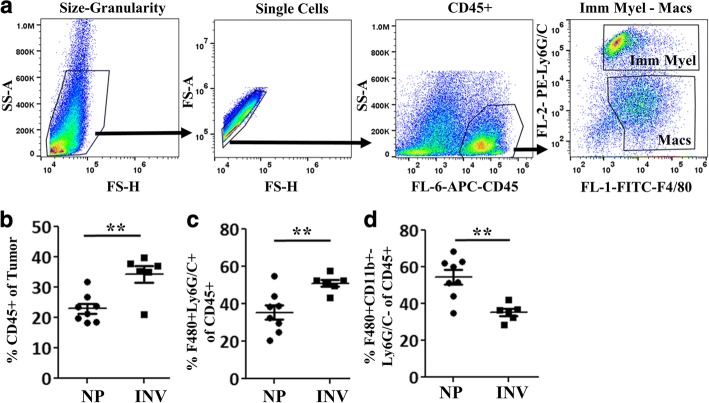
Involution group tumors are enriched for immature myeloid cells. After three weeks of in vivo growth, tumors from nulliparous (NP) and involution (INV) groups were resected, digested into single cell suspensions, and myeloid populations quantified by flow cytometry. a Representative gating schema based upon scatter, single cells, CD45+, Ly6G/C and F4/80. INV compared to NP group tumors have b increased CD45+ infiltrate, c elevated immature myeloid cell/monocyte population as classified as Ly6G/C+ F4/80+ cells, and d decreased mature macrophages classified as the F4/80+ Ly6G/C– population. Determination of statistical differences between NP and INV were based upon two-tailed Student’s t-test comparison with p < 0.01 (**)

