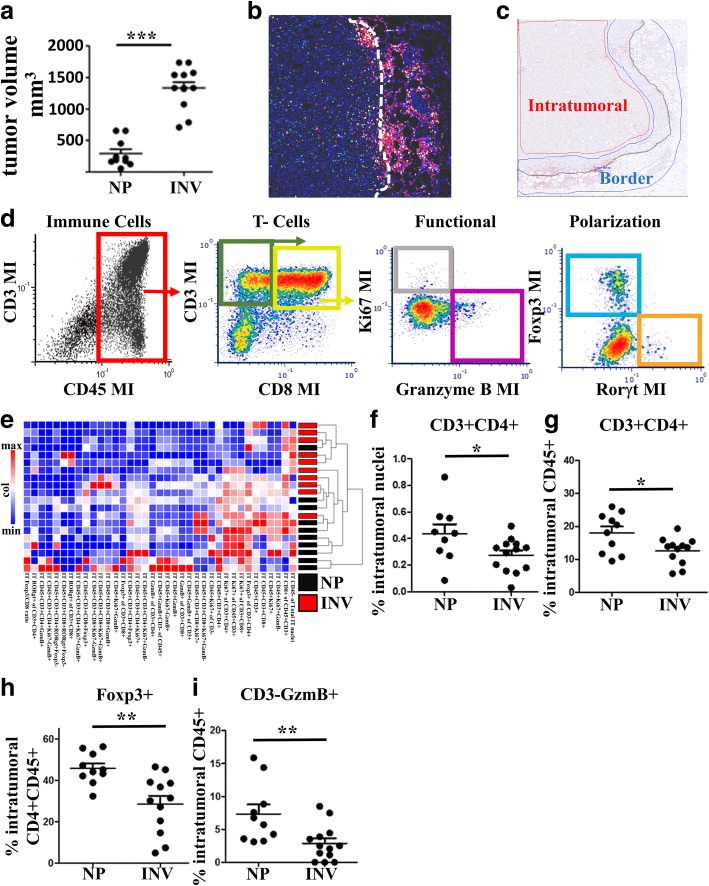
Fig. 3.
Seven antibody multiplex IHC analysis to characterize T cell composition of nulliparous and involution group tumors. A subset of study tumors a of representative size, growth and variation observed in the entire involution tumor cohort were evaluated for CD45, CD3, CD8, Ki67, Foxp3, Rorγt, and GzmB using multiplex IHC. b Representative image of INV group tumor where immune cell IHC signals have been pseudo-colored (all colors other than blue nuclei) illustrates an enrichment of immune cells at the tumor border (dashed white line). c Multiplex IHC signal was segmented based upon signal location relative to the tumor border (black line), with tumor border region (area between blue lines) and intratumoral regions (area inside red line) analyzed separately. d Representative image cytometry gating schema for T cell populations of interest evaluated in bulk by e hierarchical clustering of intratumoral lymphocytes and individually, showing a decrease in involution tumors of intratumoral CD3 + CD4+ T cells as proportion of f all intratumoral cells and g intratumoral CD45+ cells, with h Foxp3 + CD4+ T cells reduced as compared to all intratumoral CD3 + CD8-(putative CD4+) T cells, and i CD45 + CD3-Gzmb+ immune cells are decreased relative to intratumoral CD45+ cells during involution as well. Determination of statistical differences between nulliparous (NP) and involution (INV) were based upon two-tailed Student’s t-test comparison with p < 0.05 (*), p < 0.01 (**), and p < .001 (***)

