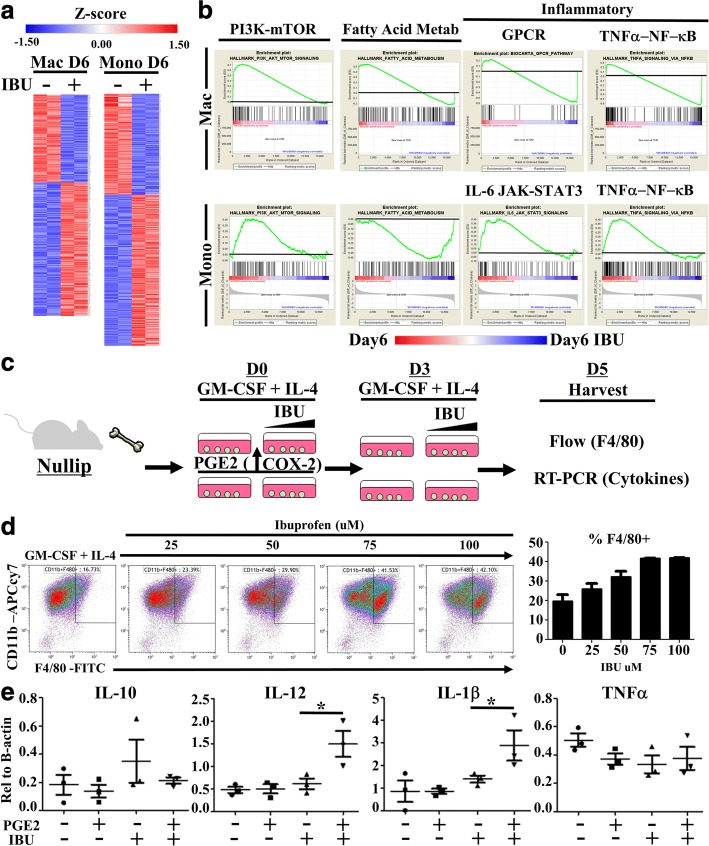
Fig. 7.
Involution associated macrophages and monocytes are targets of ibuprofen. Immature monocytes and macrophages from involution day 6 (D6) mice fed 300 mg/kg ibuprofen chow (+) or normal chow (−) were flow sorted based upon expression level of F4/80 and lineage negative marker. RNA was purified and subjected to whole exome RNA sequencing. a Significantly differentially expressed genes were determined based upon fold change and p-value distribution for Macrophages (Mac) and Monocytes (Mono) separately and graphically represented as relative z-score gene expression by gene (row). b Whole gene sets for macrophages (top row) or monocytes (bottom row), each with and without ibuprofen, were subjected to Gene Set Enrichment Analysis using publically available gene sets. The highly enriched gene sets for PI3K-mTOR, fatty acid metabolism, GPCR, TNFα-NFkB, and IL-6 Jak-STAT3 G protein-coupled receptor (GPCR), were selected for graphical representation. Black lines denote level of zero enrichment. Peaks or valleys that occur on the edges represent pathways differentially regulated by ibuprofen. c Bone marrow monocyte cultures were established by incubation of bone marrow cells from nulliparous animals in the presence of GM-CSF (20 ng/mL) and IL-4 (10 ng/mL) with increasing concentrations of ibuprofen for five days (D5) with or without an initial introduction of PGE2 (.92 ng/mL). Media was replenished with fresh ibuprofen where indicated on day 3 (D3). Day 5 adherent and non-adherent cells were collected for evaluation of monocyte maturation by d flow cytometry evaluation of CD11b and F4/80 expression and e RNA expression of cytokines relative to b-actin by RT-PCR. Comparisons of statistically significant differences were based upon two-tailed Student’s t-test between the indicated groups with p < 0.05 (*)

