Fig. 2.
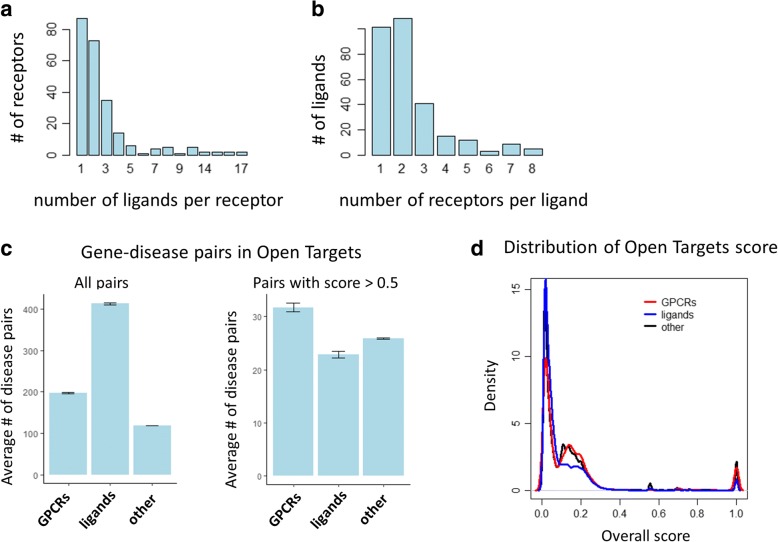
Characterizing GPCRs and endogenous ligands. a Number of endogenous ligands per GPCR and (b) number of GPCRs per endogenous ligand. c Average number of gene-disease pairs by GPCR, endogenous ligand, and all other target types using all pairs (left) and pairs with overall score > 0.5 (right). d Distribution of overall scores by target type (GPCR, endogenous ligand, and all other)

