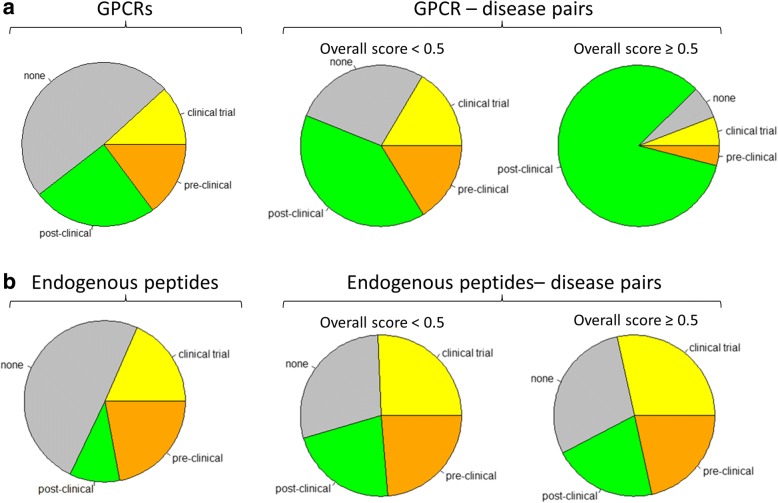
Fig. 4.
GPCRs (a) and endogenous peptidergic ligands (b) and the highest stage in global pharma pipeline. In each panel, the leftmost chart shows the distribution of highest stage (post-clinical, clinical trial, pre-clinical, none) by target type while the other two charts show such distribution among the gene-disease pairs within the Open Targets platform stratified by corresponding overall score (< 0.5, middle; ≥0.5 right)

